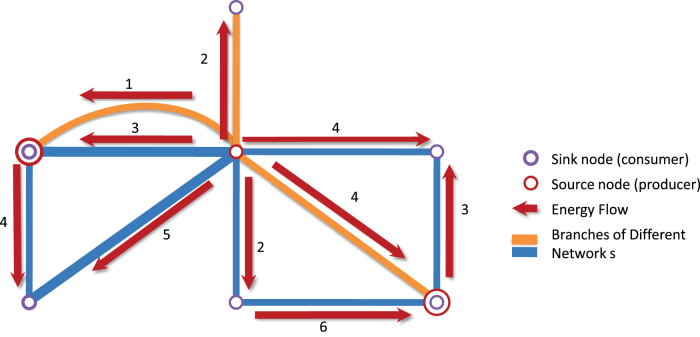
Figure 4. Schematic diagram of energy flow in artificial networks.
For example, nodes in this figure can be treated as cities, and the lines of different colours represent branches of different networks, such as electricity transmission lines and gas pipelines. Red arrows denote the direction of energy flow between different cities; the figure represents the flow of energy.

