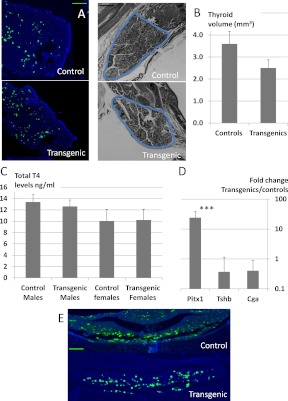
Fig. 4.
Subtle phenotypic changes in Pitx2flox/−;Tg(Tshb-cre) mice and dramatically increased Pitx1 transcripts. A, TSH immunostaining (green) and DAPI staining (blue) were done on pituitaries from 8-wk-old Pitx2flox/−;Tg(Tshb-cre) (transgenics) and controls. TSH staining was performed in three transgenics and three controls, in five pituitary sections at regular intervals for each mouse. The magnification bar for the pituitary sections is equivalent to 100 μm. B (left), Hematoxylin and eosin-stained thyroid gland sections from 8-wk-old control and Pitx2flox/−;Tg(Tshb-cre) transgenics were quantified for thyroid volume (blue line circumscribes the thyroid tissue). The magnification bar for the thyroid sections is equivalent to 200 μm. B (right), Thyroid volumes were averaged from four controls and four Pitx2flox/−;Tg(Tshb-cre) mice. C, Serum T4 levels were measured in control and Pitx2flox/−;Tg(Tshb-cre) transgenic mice by RIA. D, Pituitary mRNA samples from adult controls and Pitx2flox/−;Tg(Tshb-cre) transgenic mice were reverse transcribed, and levels of Pitx1, Tshb, and Cga cDNAs were quantified by PCR. Results are presented on a logarithmic scale as the fold change in levels in Pitx2flox/−;Tg(Tshb-cre) mice compared with controls. ***, P < 0.001. E, Newborn control and Pitx2flox/−;Tg(Tshb-cre) pituitaries were fixed, embedded, sectioned, and immunostained for TSH (green) and DAPI (blue). The magnification bar for the pituitary sections is equivalent to 100 μm.

