Fig. 1.
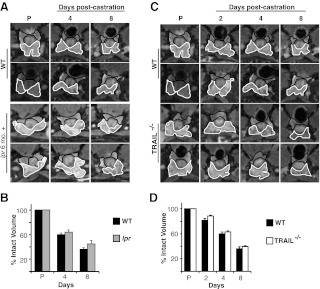
Neither FasL nor TRAIL is necessary for prostate regression after castration. A, Representative MR image series from two WT and 6-month-old lpr mice before castration (P) as well as 4 and 8 d after castration. The VP is outlined in white and the DLP in black. The genotype for each series is indicated to the left of each row. B, VP volume was calculated from MR images for WT and 6-month-old lpr animals (shown in A) before castration (P) as well as 4 and 8 d after castration. Data for each group are plotted as percentage of precastration volume (n = 4 for each genotype). Bars, sem. C, Representative MR image series from WT (from A) and two Trail−/− mice before castration (P) as well as 2, 4, and 8 d after castration. D, VP volume was calculated from MR images for WT and Trail−/− animals (shown in A) before castration (P) as well as 2, 4, and 8 d after castration. Data for each group are plotted as percentage of precastration volume (n = 4 for each genotype). Bars, sem.

