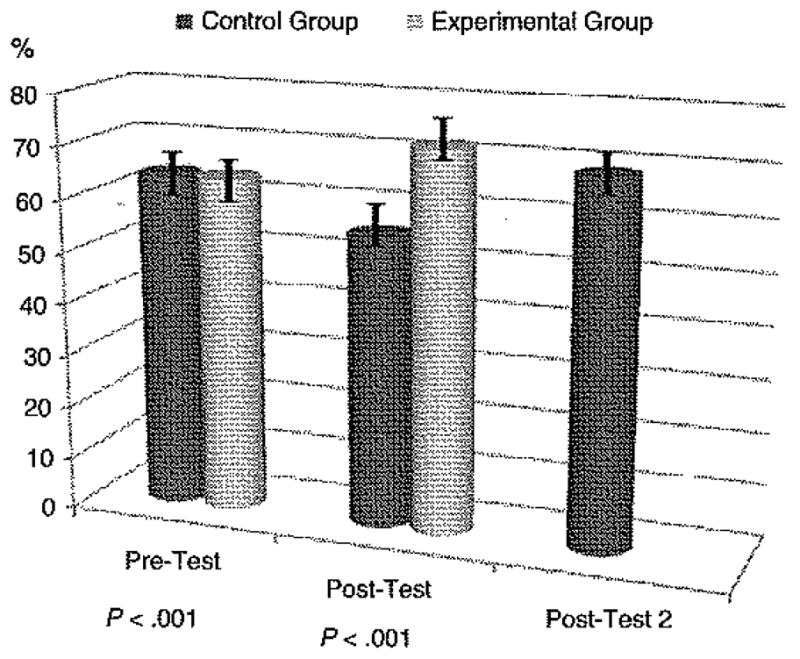
Figure 3.

Knowledge scores on the pretest and posttest between groups depicting score differences at the two time points. Mean knowledge scores for both groups were the same prior to HPS (P < .001); significantly different at Posttest I (P < .001), where the experimental group had HPS and the control group had not; and Posttest 2 for the control group revealed gains in knowledge above baseline after HPS (P < .001) with the control group.
