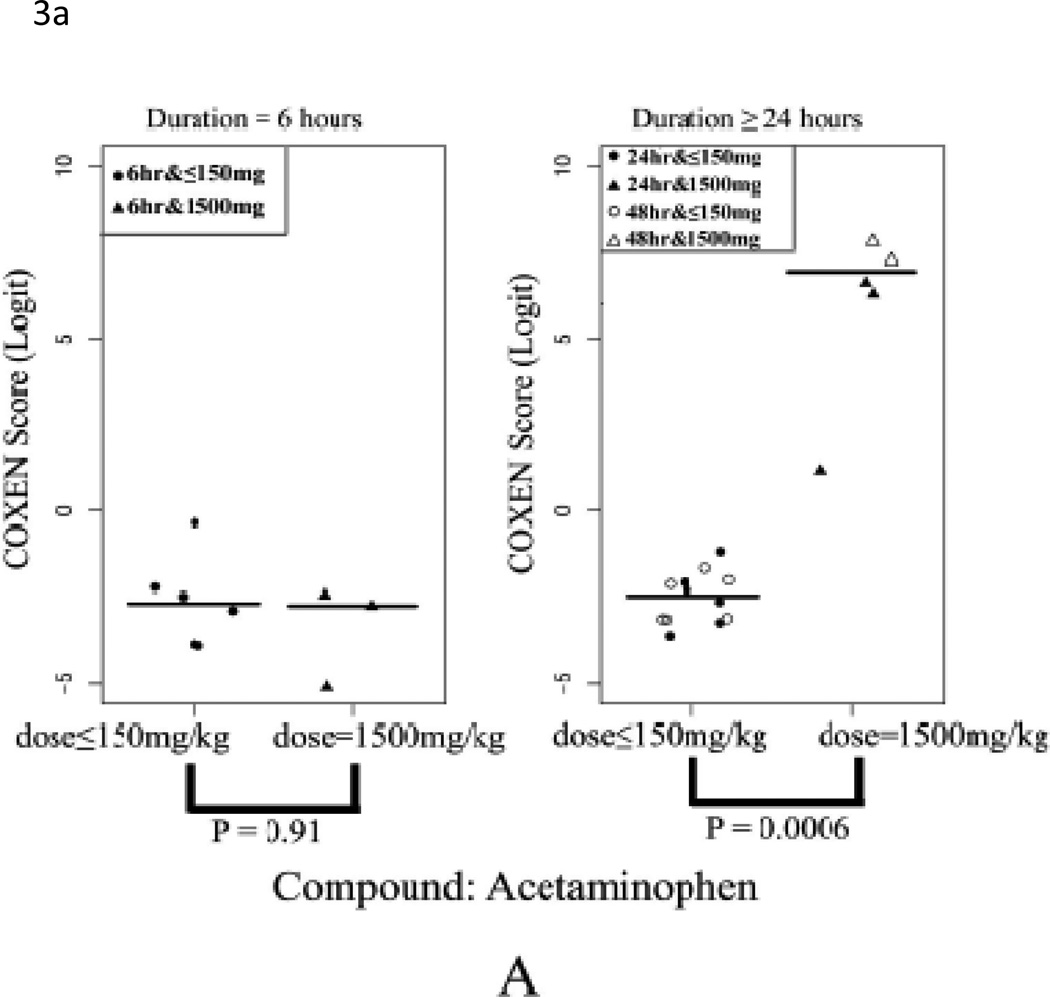
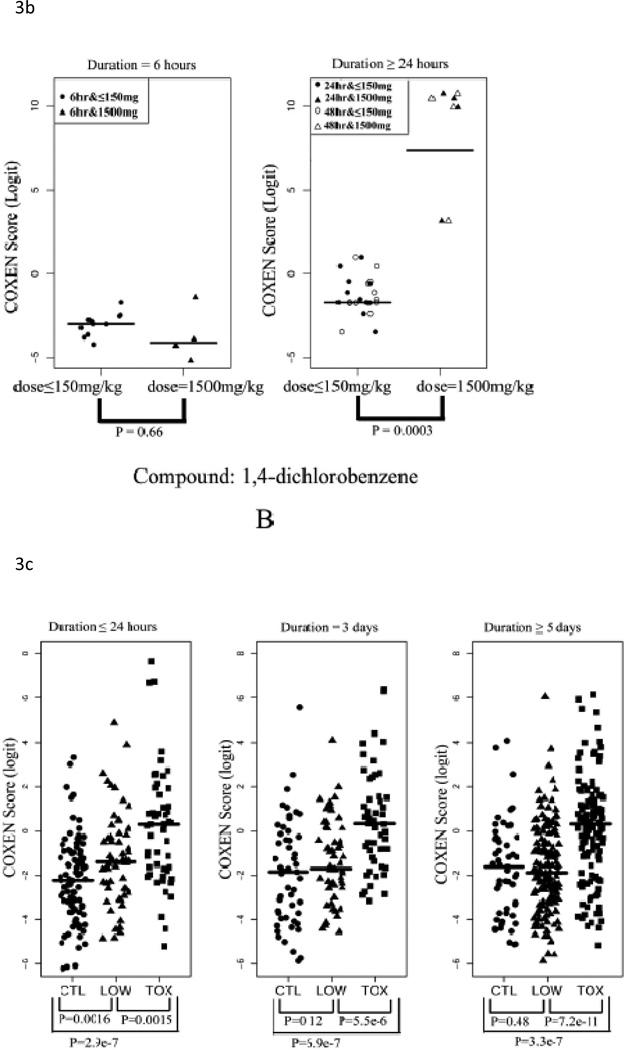
Figure 3. Prediction of in vivo data sets Rat2, Rat3 and Rat4.
(A) Comparison of COXEN scores of rats in set Rat2 treated with low dose and high sublethal-dose of acetaminophen. (B) Comparison of COXEN scores of rats in set Rat3 treated with low dose and a high sublethal-dose of 1,4-dichlorobenzene. Predicted scores of these two compounds were plotted in each of two sub-panels: 6 hrs and ≥24hrs after drug treatments. In these applications, animals treated with high sublethal-doses for 24 hrs could be perfectly discriminated from those with low doses by our prediction model. (C) Comparison of COXEN predictive scores of control rats in set Rat4 (without any treatment), rats treated with low-toxic and toxic compounds. Toxic and low toxic compounds were defined by the Micromedex database (www.micromedex.com). Predicted scores of these compounds were plotted in three sub-panels: ≤24 hrs, 3 days, and 5 days after drug treatments. Statistical significance (p value) of the set of predictions was assessed by a two sample t-test.


