
Figure 12.
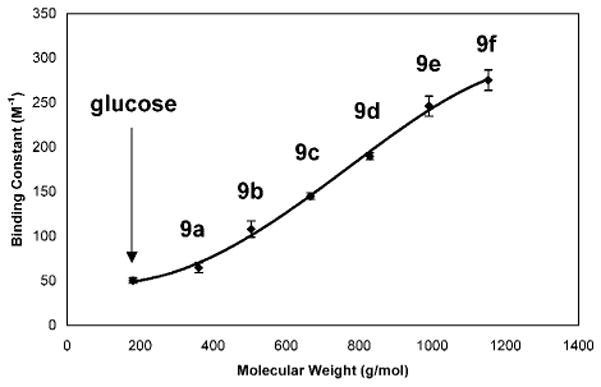
Plot of binding constant (three trials, monitored at 460 nm) vs molecular weight. Increasing molecular weight beginning with α-D-glucose through the series of linear maltodextrins (9a–f) results in an increase of binding constants (65.0, 108.3, 145.0, 189.7, 246.0, and 275.0 M−1) in colored solutions containing 2a. The binding constants are reproducible within ±10%.