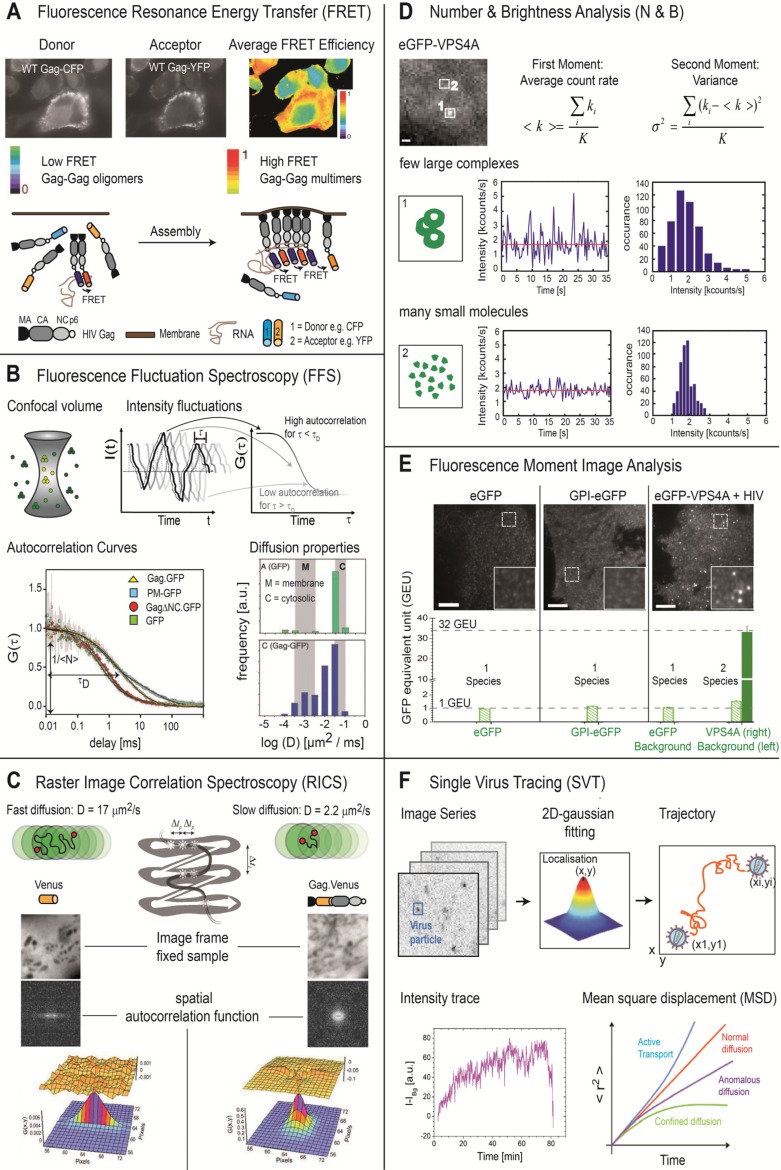
Figure 1.
Selective methods for quantitative fluorescence analysis of HIV-1 assembly. Numerous fluorescence methods are available for investigating the dynamics of viral processes and virus-cell interactions. A few of them are highlighted in the figure. (A) FRET can be used to investigate the spatial distribution of molecular interactions in live cells. Using Gag.CFP and Gag.YFP, Hogue et al. investigated the interaction of WT and mutant Gag molecules in the cytosol and plasma membrane using FRET [18]. (B) FFS uses fluctuations in fluorescence intensity to determine the mobility of fluorescently labeled molecules. From FFS experiments on GFP-tagged Gag with deletion of the nucleocapsid (NC) domain, plasma membrane bound GFP, and cytosolic GFP, Larson et al. demonstrated that the mobility of Gag is significantly decreased in the plasma membrane as shown by the shift in the correlation curve to longer times. Thus, with FFS, they could investigate the role of NC in the assembly process [19]. (C) RICS measures the mobility of fluorescence molecules by utilizing the correlations between pixels in a raster‑scanned image. The RICS autocorrelation function for Venus (left) and Venus‑labeled Gag (right) are shown. (D) N&B Analysis determines the number and molecular brightness of the labeled biomolecules from the fluctuations in fluorescence intensity over time. A small number of large bright complexes will show a larger variance in the measured fluorescence intensity than a larger number of dim molecules, even though the average fluorescence intensity may be similar. (E) Fluorescence moment image analysis uses the fluorescence intensity distribution of an image to determine the number and brightness of complexes in the image. A higher-order moment analysis was performed by Baumgärtel et al. to estimate the number of VPS4 molecules that interact with nascent HIV-1 assembly sites [20]. (F) SVT can be used to following individual viruses as they enter or exit living cells. The position of the virus is determined in each frame by fitting the point-spread function to a 2D Gaussian, yielding the trajectory. From the trajectory information, the fluorescence intensity during the trajectory or the diffusional behavior can be determined [21].

