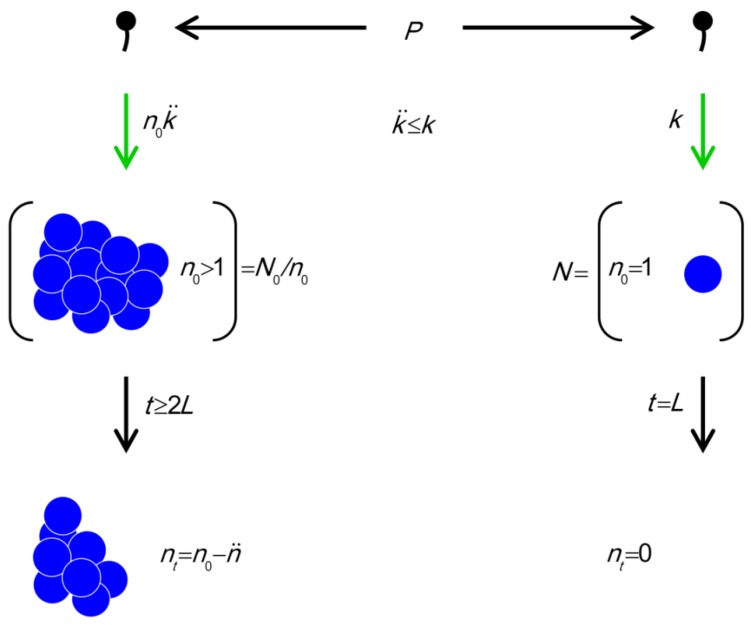
Figure 4.
The model. Parameters include P (density of phages in environment), k (phage adsorption constant),  (phage adsorption constant considering reductions due to shading of bacteria by bacteria found within bacterial arrangements), n (number of bacteria found per arrangement), N (bacterial density of overall environment), L (phage latent period, which is the duration of a phage infection), and
  (number of bacteria per arrangement lost subsequent to phage infection of one cell in the arrangement). Likelihood of phage adsorption of bacterial arrangements is n
 and density of arrangements within environments is equal to N/n = N0/n (or indeed n0
 and N0/n0, respectively, to reflect that n changes as a function of time in the figure). The inequality t ≥ 2L indicates how phage acquisition of bacteria within a bacterial arrangement, according to this model, involves at least two sequential rounds of phage infection. The absence of cells in the lower right is intentional as too is the reduction in cell number to nt in the lower left. Both of these reductions in cell number, going from middle to bottom, indicate phage-induced bacterial lysis.

