
Table 1.
Summary of predictions as a function of phage densities in environments and phage potential to acquire bacteria sequentially within bacterial arrangements (Recall in interpreting the table that the inequality, Nt / N0 > At / A0, implies greater success over time in the face of phage-mediated predation for free bacteria versus bacteria found within arrangements while Nt / N0 < At / A0 implies the opposite). Generally, k/ ≥ 1. Calculations relevant to lower phage densities, as found in the bottom portion of the table, are not discussed until Section 2.3.3 and especially section 2.3.4.
| Environmental Phage Density (P) | Phage Propagation Ability Through Arrangements ( ) ) |
|||
|---|---|---|---|---|
| Higher | Lower | |||
|
Higher (bacterial losses dominate dynamics) |
For  [lesser or no impediments to phage propagation within arrangements] |
For  [impediments less than absolute] |
For  [e.g., abortive infections] |
For  [e.g., phage restriction] |
|
Lower (bacterial gains dominate dynamics) |
For 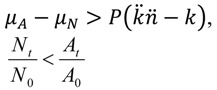 [which, as P → 0, is more likely] |
 |
[assuming phage-independent advantages to arrangement formation, i.e., μA - μN > 0, and that μA - μN > P( -k)holds, which is likely given both P → 0 and
→ 0] |
|