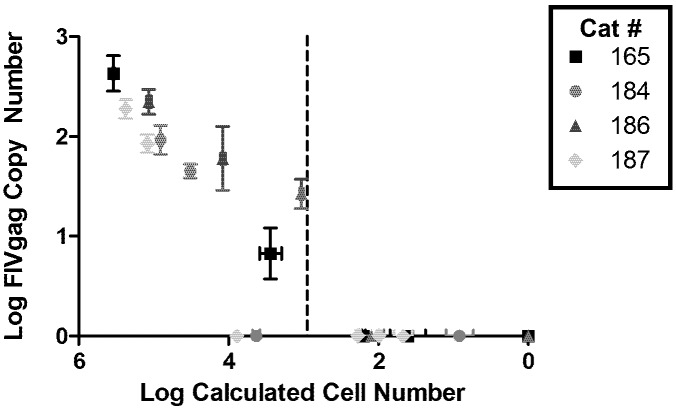
Figure 1.
Quantification of feline immunodeficiency virus (FIV) proviral load in CD4+ T-cells. Log FIV gag copy number is plotted against the log of calculated cell number (based on cellular IL2 gene copies divided by 2) for 4 chronically FIV-infected cats (28–32 months post infection). Dashed vertical line represents the average cell number at which the FIV signal falls below detection level (~103 cells). Error bars represent the standard deviation of quadruplicate qPCR measurements.

