
Figure 4.
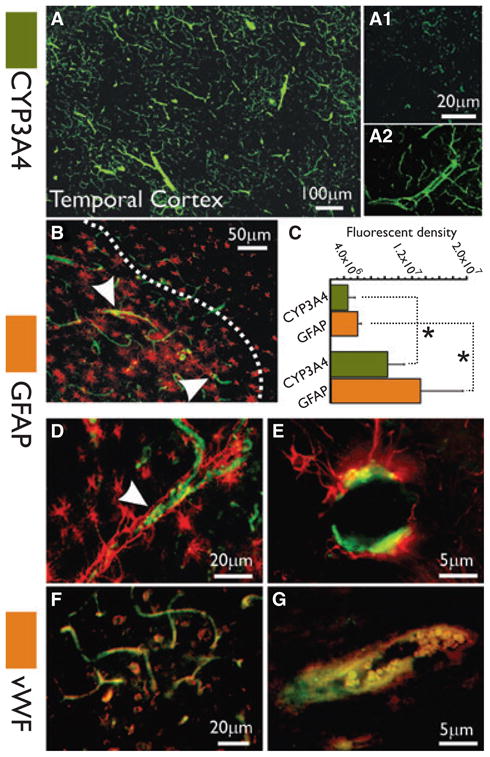
CYP3A4 expression at the blood–brain barrier of patients with drug-resistant epilepsy. (A) Montage reconstruction illustrates CYP3A4 expression in the temporal cortex of epileptic human brain. Both penetrating and small caliber vessels were positive for CYP3A4 staining (green). (B) CYP3A4 expression was more pronounced in regions of reactive gliosis, delimited by the dotted line. (D–E) Note the perivascular GFAP staining delimiting the vascular bed. (F–G) Endothelial expression of CYP3A4 colocalized with vWF. (C) CYPA4 expression (green bars) is significantly increased (*p < 0.05) in brain areas associated with reactive gliosis (bar graph n = 4 patients, three slices each). One-way analysis of variance (ANOVA) was used. Results are expressed as mean ± standard error of the mean (SEM).