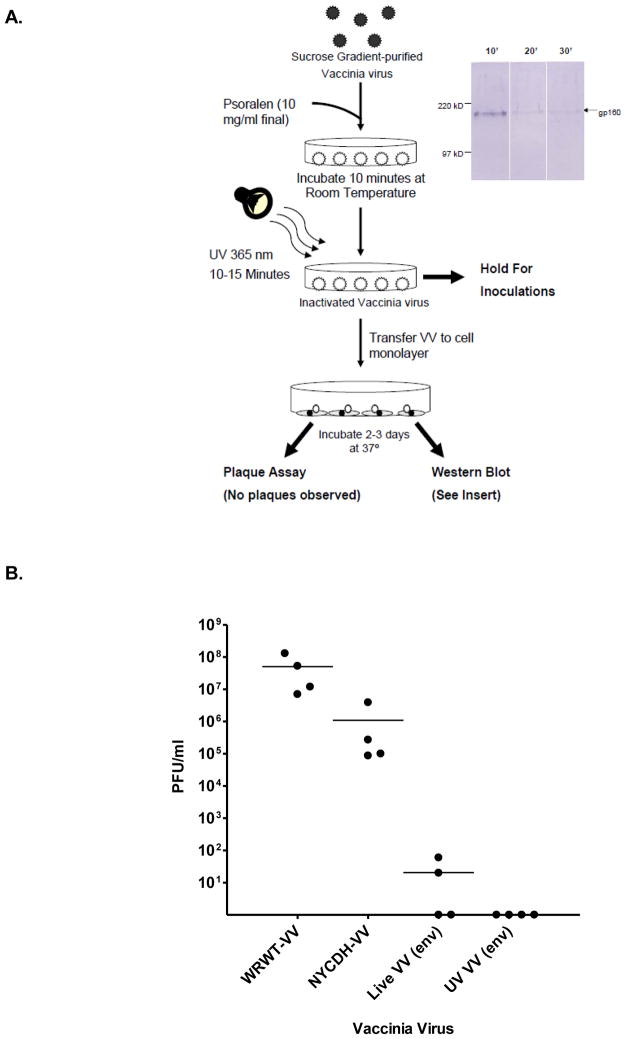
Figure 1. Inactivation of VV.
Panel A. A flowchart of VV inactivation is shown. Virus was purified by sucrose gradient and then treated with psoralen and UV light. UV-treated virus was measured by plaque assay and Western blot to ensure inactivation and to ensure capacity for protein expression.
Panel B. SCID mice were administered live VV of the WRWT strain (WRWT-VV, 107 pfu), live VV of the NYCDH strain (NYCDH-VV, 108 pfu), live recombinant NYCDH VV (Live VV (env),108 pfu) and inactivated live recombinant NYCDH VV (UV VV (env), originally 108 pfu). After 7 days, ovaries were assessed for plaque formation on mammalian cell monolayers. Results from individual mice and means are shown.

