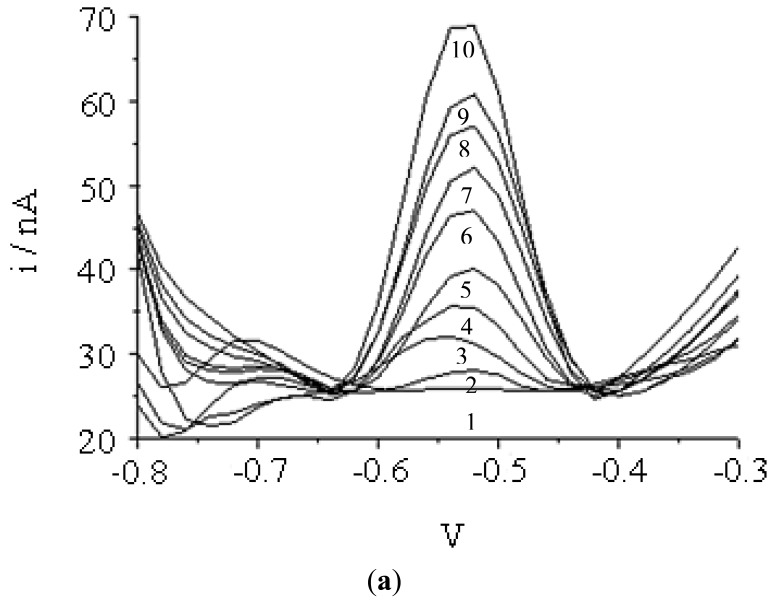
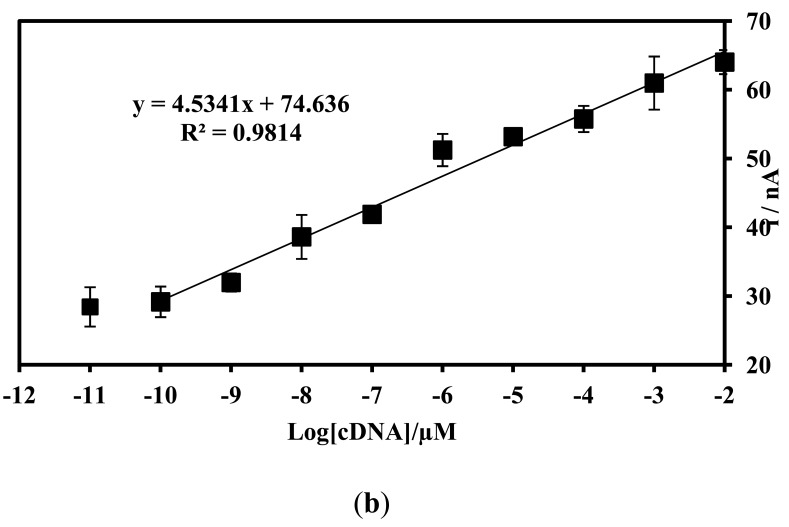
Figure 10.
(a) Differential pulse voltammograms of AQMS intercalated onto dsDNA after hybridization with different concentrations of complementary DNA: (1) 1.0 × 10⁻¹⁷, (2) 1.0 × 10⁻¹⁶, (3) 1.0 × 10⁻¹⁵, (4) 1.0 × 10⁻¹⁴, (5) 1.0 × 10⁻¹³, (6) 1.0 × 10⁻¹², (7) 1.0 × 10⁻¹¹, (8) 1.0 × 10⁻¹⁰, (9) 1.0 × 10⁻⁹ and (10) 1.0 × 10⁻⁸ M; (b) The linear response range of the DNA microbiosensor response. DNA Hybridization was performed at optimum condition of 0.25 M Na-phosphate buffer (pH 7.5) and 2.0 M ionic strength and at 25 °C with 30 min of hybridization time.


