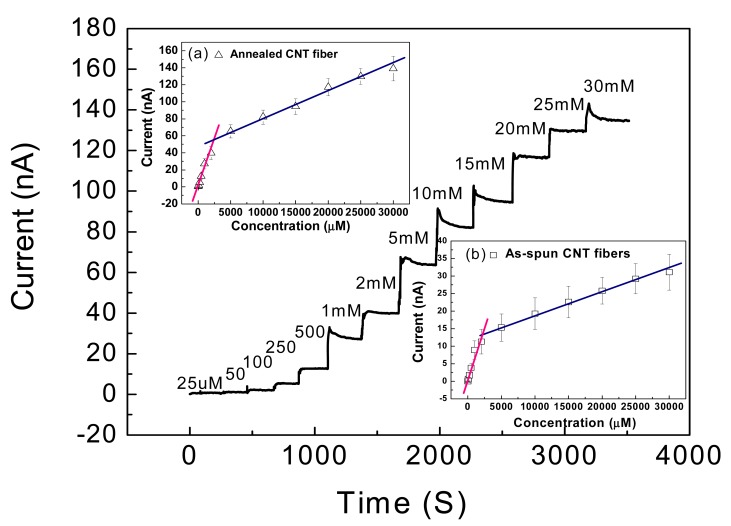
Figure 6.
Amperometric responses of CNT fiber biosensors with 30 nm gold film coating. Numbers in the chart represent the corresponding glucose concentration of the solution. The insert shows the calibration plot for annealed CNT fiber (a) and as spun CNT fiber (b): the linear ranges both divided into two parts: 25 μM to 2 mM and 2 mM to 30 mM [69].

