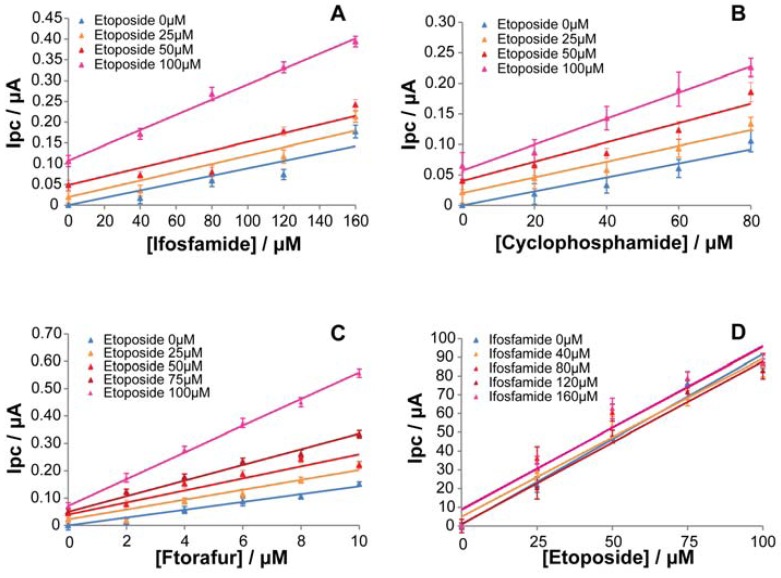
Figure 6.
Calibration curve families. Cyclic voltammetric measurements, in PBS, obtained for all drugs in their pharmacological range and etoposide at fixed concentrations (0–25–50–75–100 μM). Cytochrome P4503A4 was used for ifosfamide (A), cytochrome P4503A4 for cyclophosphamide (B), and cytochrome P4501A2 for ftorafur (C). Calibration curves for etoposide detection in its pharmacological range obtained with a CNT-electrode in presence of ifosfamide at fixed concentrations (0–40–80–120–160 μM) are illustrated in (D).

