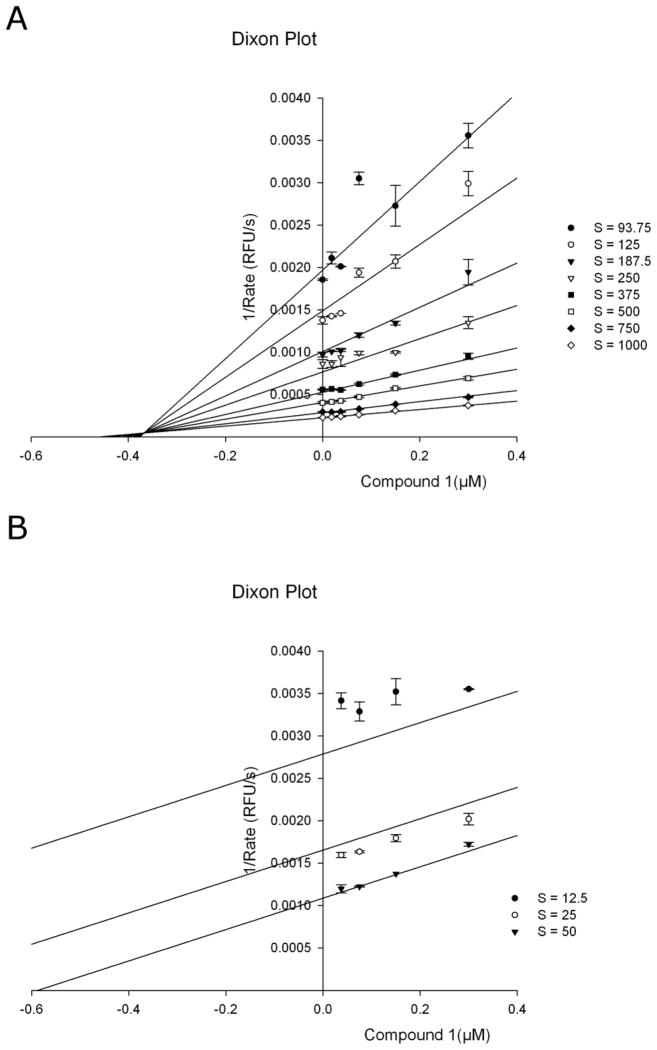
Figure 7.
(A) Dixon plot for competitive inhibition of Compound 1 with respect to the substrate crotonyl-CoA. The Ki was determined to be 0.36μM. (B) Dixon plot for uncompetitive inhibition of Compound 1 with respect to NADH (S=NADH). The experimental data used to generate these plots were fit by nonlinear regression analysis (in SigmaPlot with Enzyme Kinetics Module1.3) to equations 1–4 (Methods section) and represent a global fit of the data for all concentrations. Each of the two plots represents the best fit to the most appropriate kinetic model

