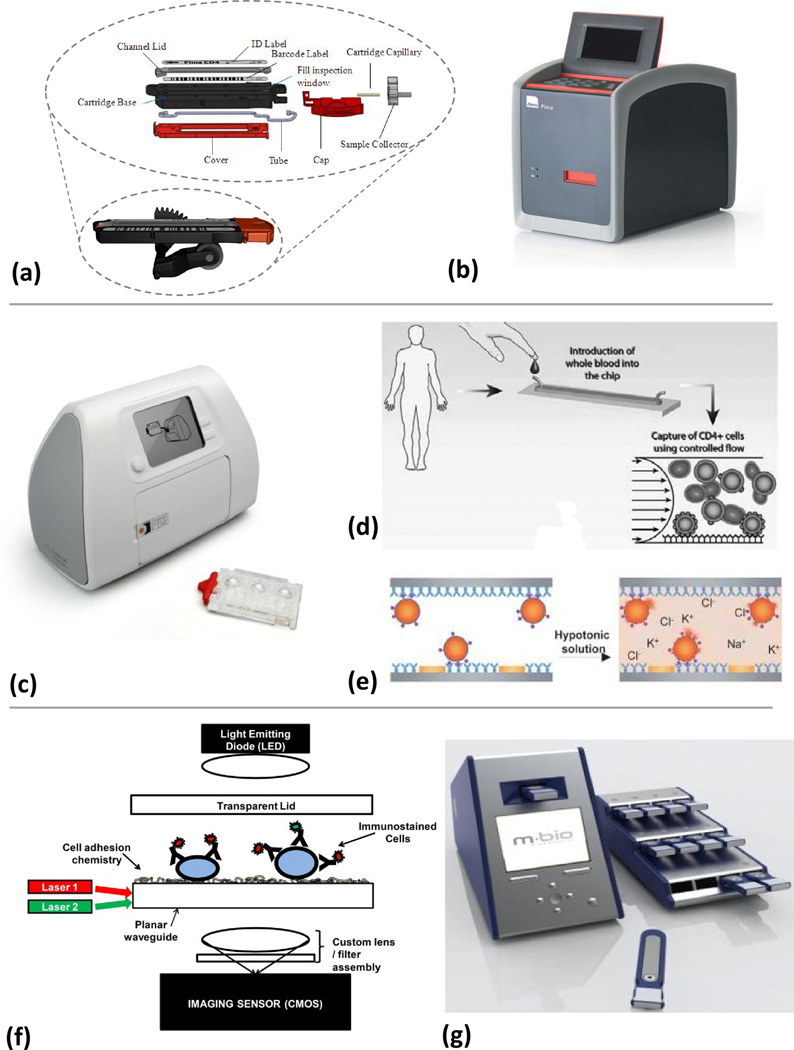
Figure 3. Working principles of different analysers.
(a) Alere Pima™ Analyser cassette, shown assembled in position on peristaltic mechanism from reader, and exploded view (b) The Pima™ reader. The disposable, bar-coded (with test ID, expiry date, and channel volume) detection cassette contains stabilized reagents in a flexible tube that is divided into a metering chamber, an incubation/reaction chamber, a reading chamber, and a pumping chamber. The cassette with 5 µL of sample is placed into the reader for processing. Peristaltic pumping moves the sample to an incubation chamber to permit reagent dissolution and antibody binding to the CD3+/CD4+ cells. The stained sample is then moved to the detection chamber, and if process controls are satisfied, images are taken at 20 discrete positions in the channel at two different emission wavelengths (images reproduced with permission from Alere). (c) The Daktari analyser test consists of a reader and a disposable cassette which contains all of the reagents, stabilized in blister packs. (d) The cassette with blood sample is placed in the instrument. Reagents are released from the blister pack and pass into the test chamber. The blood moves at a predefined flow rate through a chamber functionalized with anti-hCD4 monoclonal antibodies (shown here in side view), resulting in shear-gradient (represented by the parabola with flow-velocity arrows) enhanced chromatographic separation from monocytes (adapted from [46]). (e) The retained CD4 cells are lysed and the released ions are detected by impedance spectroscopy, the signal of which correlates to the CD4 count (adapted from [47]). The heavy gray lines represent the electrodes. (Reproduced with permission of The Royal Society of Chemistry). (f) A schematic of the mBio SnapCount™ CD4 analyser and cartridge shows that three images can be taken by the CMOS of each location in the cartridge: A bright field image (illuminated by the LED), and two fluorescence images for the fluorophores on the anti-hCD3+ and the anti-hCD4+ (illuminated by two laser diodes and a proprietary waveguide). Flow into the cartridge is passive. (g) The SnapCount™ analyser, with a single cartridge in front and a work-rack of cartridges along side. The rack facilitates the loading of multiple cartridges for parallel processing (images and schematic reproduced with permission from mBio).

