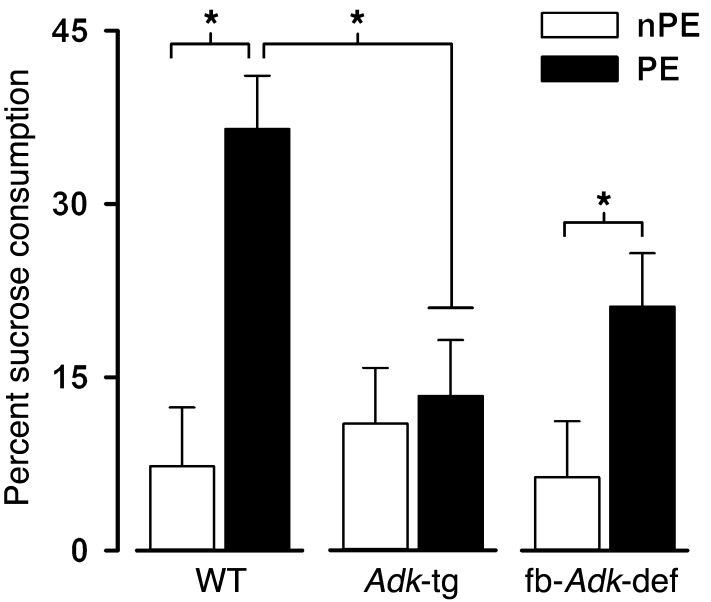
Figure 2. LI in the CTA paradigm.
Taste aversion was indexed by percentage sucrose consumption. The lower the value, the greater the taste aversion. Weaker aversion in PE animals relative to that in nPE animals constitutes the LI effect. LI was present in WT and fb-Adk-def mice but completely abolished in Adk-tg mice (n = 9–11 per group). *P < 0.05 based on post-hoc comparison, following a significant interaction in the overall ANOVA. Data are mean ± SEM.

