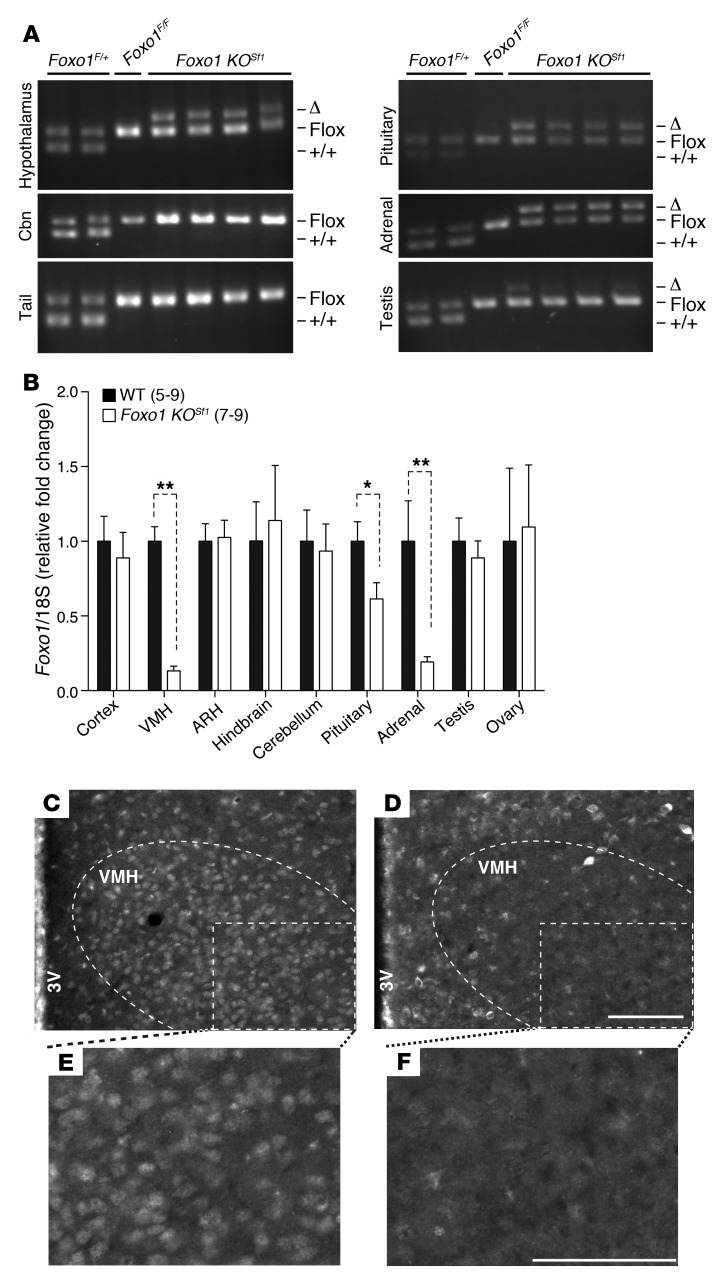
Figure 1. Validation of Foxo1 KOSf1 mice.
(A) PCR genotyping using hypothalami, cerebella, tails, pituitary glands, adrenal glands, and testes from Foxo1F/+, Foxo1F/F, and Foxo1 KOSf1 mice. (B) Relative Foxo1 expression in indicated tissues. Numbers of animals examined are expressed in parentheses. (C and D) Low-power view of FOXO1 immunostaining in mediobasal hypothalami of (C) WT and (D) Foxo1 KOSf1 mice. (E and F) High-power view of FOXO1 staining indicated with white boxes in C and D. The data are expressed as mean ± SEM (*P < 0.01, **P < 0.0001, Student’s t test). 3V, third ventricle. Cbn, cerebellum. Scale bar: 100 μm.

