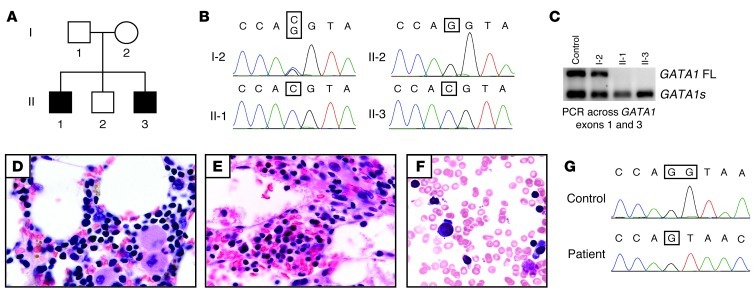
Figure 1. Identification of GATA1 mutations in DBA.
(A) Pedigree of a family with DBA in 2 male children and normal hematological findings in the parents. (B) Sanger sequencing chromatograms from the 3′ end of exon 2 and 5′ end of intron 2 on GATA1 in the mother (I-2) and 3 children from the family shown in A. (C) RT-PCR analysis of GATA1 exons 1 and 3 from peripheral blood RNA samples from the patients (II-1 and II-3); their mother (I-2), who carries the GATA1 mutation; and a normal control. FL, full-length. (D and E) Bone marrow core sections from II-1 and II-3 shown at ×100 magnification demonstrate erythroid hypoplasia. (F) Rare erythroblasts with normal morphology were noted on bone marrow aspirates (from II-1; shown at ×100 magnification). (G) Sanger sequencing chromatograms show a GATA1 G nucleotide deletion (at the exon 2–intron 2 junction) in an independent male patient with DBA.

