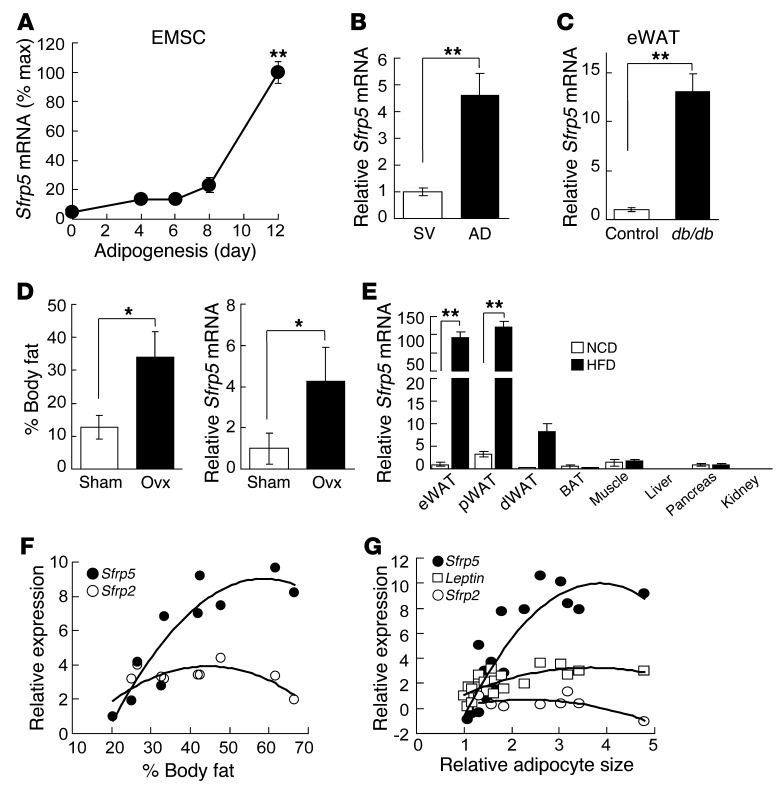
Figure 1. Sfrp5 mRNA is induced during adipogenesis and further increased with obesity.
(A) RNA was isolated from EMSCs during adipogenesis (average Ct at day 12, 27.5). Values were normalized to Tbp mRNA. n = 7–11. (B) Sfrp5 mRNA was higher in adipocytes (AD; average Ct, 24.8) than the stromal vascular fraction (SV; average Ct, 33.0). n = 10. (C) Increased Sfrp5 mRNA in eWAT of 12-week-old male Leprdb/db mice (Ct, ∼24.0) relative to Lepr+/+ controls (Ct, ∼27.5). n = 7 per group. (D) Increased Sfrp5 in WAT after ovariectomy (Ovx). Shown is percent body fat 8 weeks after surgery and relative Sfrp5 mRNA expression in dorsolumbar WAT of ovariectomized (Ct, ∼18.8; n = 5) and sham-operated control (Ct, ∼21.6; n = 6) mice. (E) Beginning at 8 weeks of age, mice were fed NCD or HFD for 12 weeks, and Sfrp5 mRNA was assessed in eWAT (NCD Ct, ∼30.2; HFD Ct, ∼19.91), perirenal WAT (pWAT), dorsolumbar WAT (dWAT), brown adipose tissue (BAT), muscle, liver, pancreas, and kidney. n = 7 per group. (F) Assessment of Sfrp5 and Sfrp2 mRNA in eWAT from mice fed low-fat diet or HFD for 6 months (n = 10 per group) showed a positive correlation between Sfrp5 mRNA expression and percent body fat (R2 = 0.84). (G) Positive correlation between adipocyte size and Sfrp5 mRNA (R2 = 0.78). Leptin (R2 = 0.5141) and Sfrp2 (R2 = 0.1917) are shown for comparison. For A–E, values are mean ± SEM. *P < 0.05; **P < 0.01.

