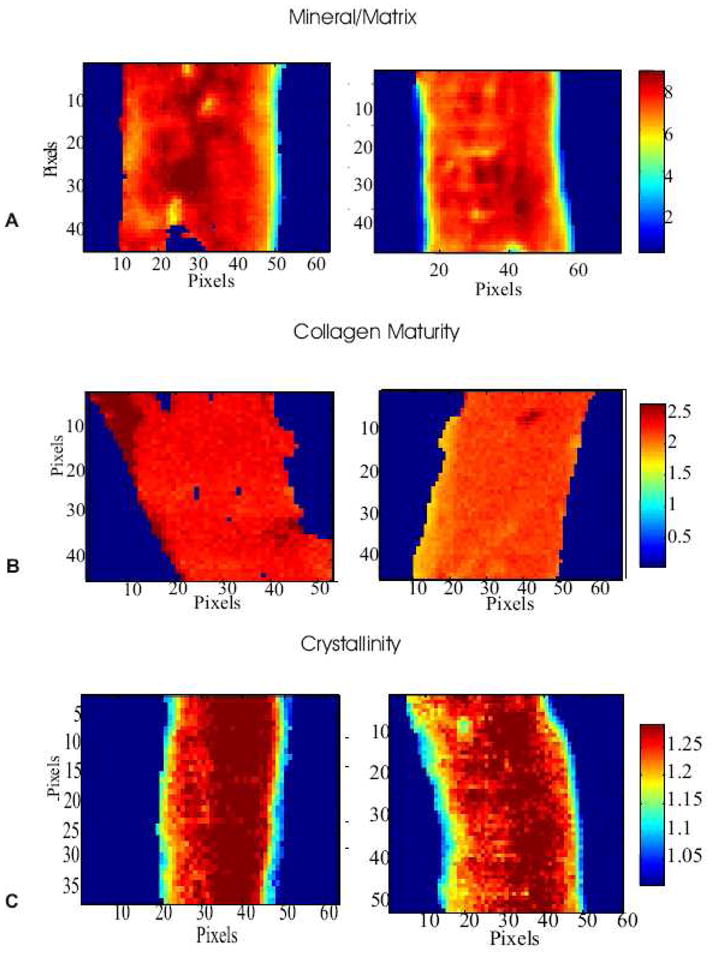
Figure 2.

Typical FTIRIs of various spectral parameters in control and leaded treated cortices. Representative images of (A) mineral to matrix ratio, (B) collagen maturity (peak height ratio 1660/1690) and (C) crystallinity (peak height ratio 1030/1020).
