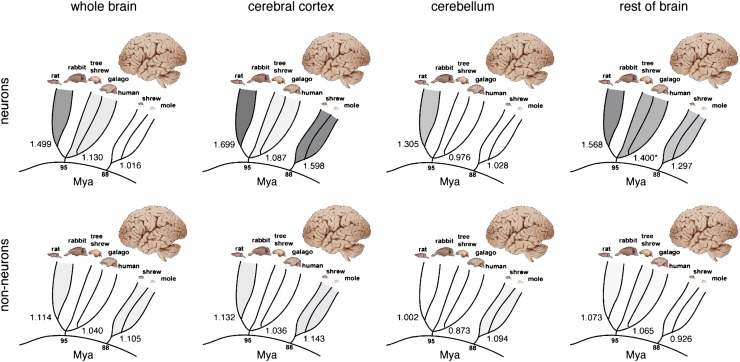
Fig. 2.
Comparison of allometric exponents for total brain mass, cerebral cortex mass, cerebellar mass, and the rest of the brain mass as a function of numbers of neurons (Upper) or nonneuronal cells (Lower). Exponents, given at the base of the radiation of each individual group (Glires, Primata/Scandentia, and Eulipotyphla), are illustrated by the intensity of the shading. Data are from studies by Herculano-Houzel and her colleagues (22–27); exponents are from a study by Herculano-Houzel (20).

