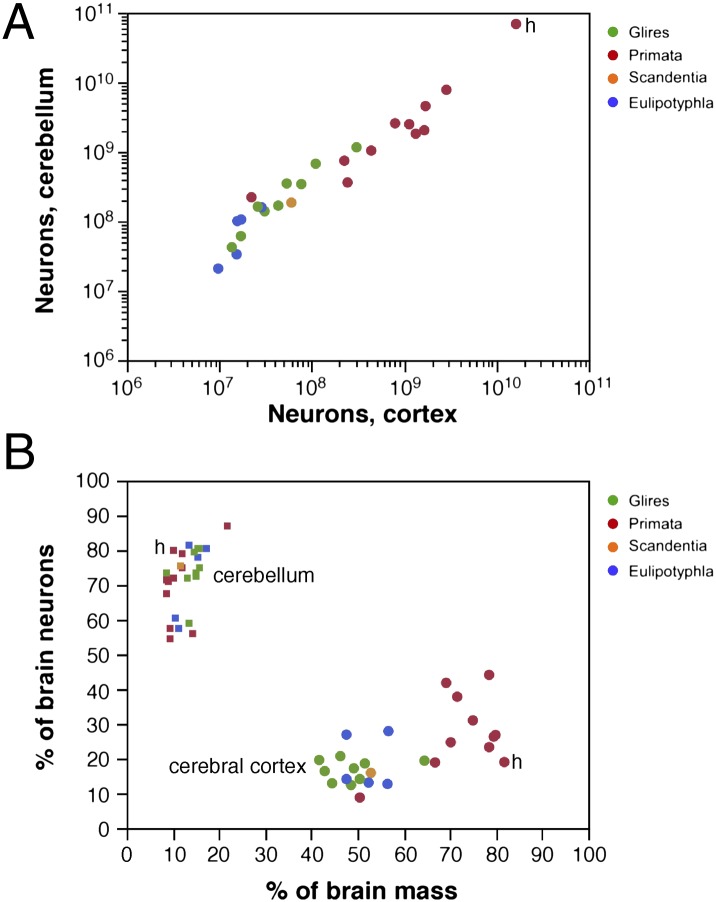
Fig. 4.
Coordinated scaling of the number of neurons in the cerebral cortex and cerebellum of mammals. (A) Number of neurons in the cerebellum covaries with the number of neurons in the cerebral cortex across all species in a way that can be described as a linear function of slope 4.2 (P < 0.0001, r2 = 0.995). (B) Increased relative cortical mass does not reflect an increased relative number of brain neurons. Each point represents the average values for one species (insectivores, blue; rodents, green; primates, red; Scandentia, orange). Circles represent relative mass and relative number of brain neurons in the cerebral cortex; squares represent relative values for the cerebellum. All Spearman correlation P values are >0.2. Data are from studies by Herculano-Houzel and her colleagues (22–27). h, human data points.

