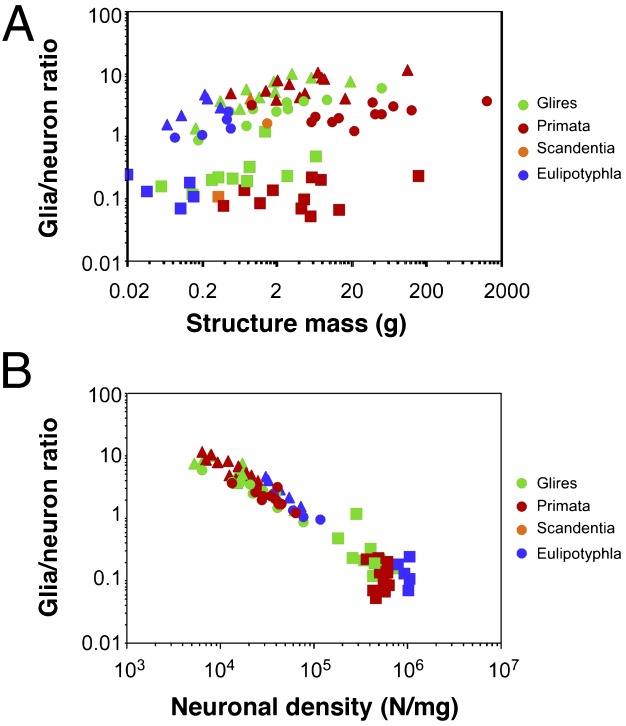
Fig. 5.
G/N ratio scales differently across structures and orders with structure mass, but scales homogeneously with neuronal density. Each point represents the average other cell/neuron ratio (which approximates the G/N ratio) and structure mass (A) or neuronal density (B) in the cerebral cortex (circles), cerebellum (squares), or rest of brain (triangles) of a species. Notice that in contrast to the scattered distribution across species and structures in A, data points are aligned across species and structures in the lower plot, suggesting that it is smaller neuronal densities (i.e., larger average neuronal cell size), rather than larger structure mass, that is accompanied by a larger G/N ratio. Data are from studies by Herculano-Houzel and her colleagues (22–27).

