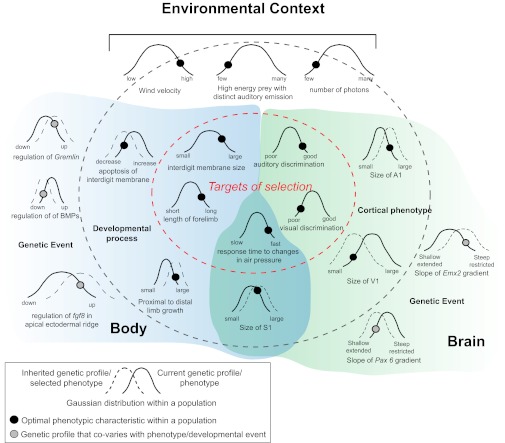
Fig. 7.
Schematic illustration demonstrating how covaration between the targets of selection, phenotypic organization, and genetic events could lead to inheritance of genes that generate a population of future individuals with a unique combination of phenotypic characteristics. Blue shading corresponds to factors associated with forelimb morphology, and green shading corresponds to factors associated with brain organization. These are not mutually exclusive but interact to some extent (overlapped shading). The Gaussian curves represent the range of naturally occurring variability in a specific characteristic, with narrower curves representing robust characteristics and wider curves representing stochastic characteristics. The black and gray circles represent the location of the optimal characteristic along the current distribution (solid curve). Selection pressures will eventually push the population to a new distribution, centered around the optimal characteristic (dashed curve). In this example our species is an echolocating bat, and our environmental context is illustrated at the top. Some of the targets of selection (Gaussian curves inside the red, dashed oval) would be characteristics of the forelimb that allow for flight, as well as behaviors such as fast response time and good auditory discrimination. Cortical phenotypic characteristics (located between the dark gray and red dashed lines) that underlie auditory and tactile discriminatory ability would include an increase in the size of S1 and A1, as well as an increase in the wing representation within S1. Underlying developmental processes associated with wing formation include a decrease in apoptosis in the interdigit membrane and the growth of the limb. At the far perimeter (far left and far right) of this illustration are the genetic events that covary with aspects of the body and brain phenotypes.

