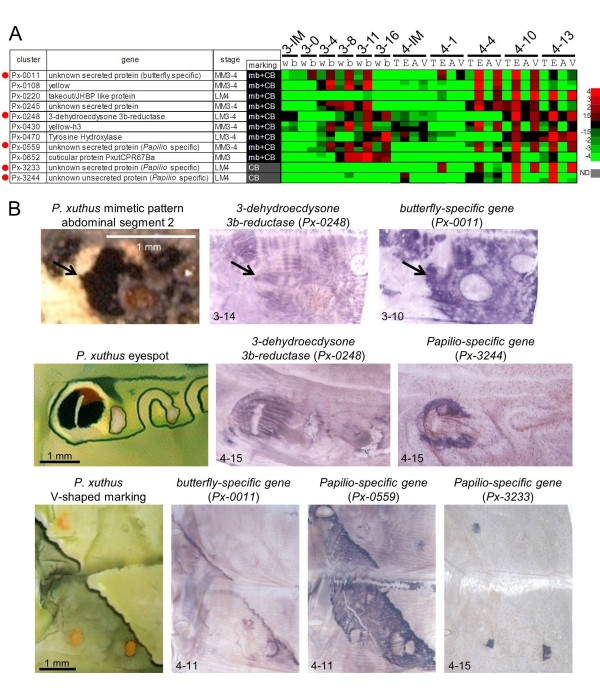
Figure 10.
Expression pattern of novel marking-specific genes. (A) Heat map of the relative expression level of nine marking-specific genes regarded as mimetic black and cryptic black, and two Papilio-specific genes (Px-3233, Px-3244) regarded as cryptic black. Red indicates positive values and green indicates negative values (color spectrum bar is shown to the right; N.D., not detected). Red circles indicate the genes examined by whole-mount in situ hybridization in (B). Stage and marking of each sample is shown above. The stage-specific co-expression cluster and marking specificity of each gene are also shown. See also Figures 2 to 4. (B) Spatial expression patterns of novel marking-specific genes' mRNA in P. xuthus larva during the third and fourth molts. Numbers in each panel indicate molt stage-hours after head capsule slippage. Arrow indicates black spot region on the abdominal segment 2 of mimetic pattern.

