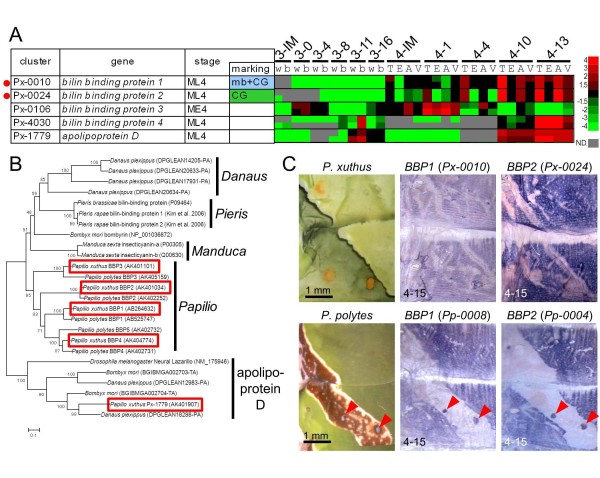
Figure 5.
Expression pattern of bilin-binding protein genes. (A) Heat map of four bilin-binding protein genes and their related gene apolipoprotein D in P. xuthus. Red indicates positive values and green indicates negative values (color spectrum bar is shown to the right; N.D., not detected). Red circles indicate the genes examined by whole-mount in situ hybridization in (C). Stage and marking of each sample is shown above. The stage-specific co-expression cluster and marking specificity of each gene are also shown. See also Figures 2 to 4. (B) Neighbor joining tree of bilin-binding protein and its related genes based on their amino acid sequences. The numbers at the tree nodes represent the bootstrap values. The scale bars indicate the evolutionary distance between the groups. Accession numbers or gene model numbers are shown in parenthesis. Red boxes indicate the P. xuthus genes. Predicted genes of D. plexippus and B. mori were from MonarchBase http://monarchbase.umassmed.edu/ and KAIKObase http://sgp.dna.affrc.go.jp/KAIKObase/, respectively. (C) Spatial expression patterns of two bilin-binding protein gene mRNAs in P. xuthus and P. polytes larvae during the fourth molt. Numbers in each panel indicate molt stage-hours after head capsule slippage (HCS). Red arrowheads indicate blue spot region of P. polytes.

