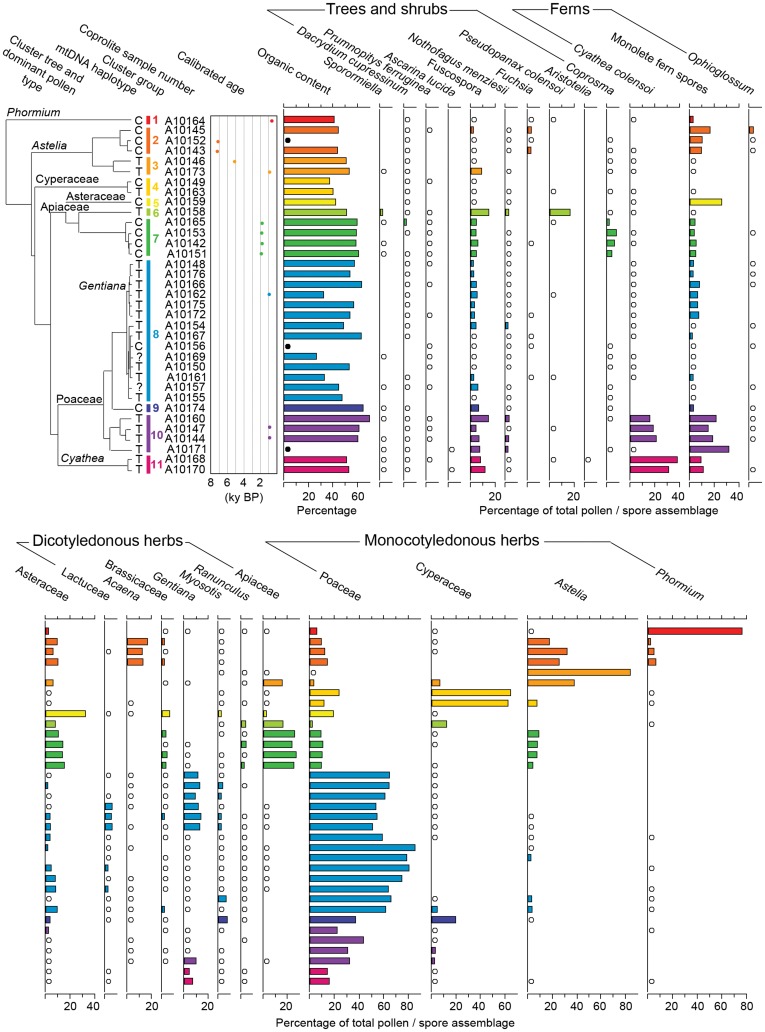
Figure 2. Pollen diagram for upland moa coprolites from Euphrates Cave.
Pollen assemblages are plotted with cluster analysis tree of coprolites based on pollen assemblages, calibrated ages of radiocarbon dated coprolites, and organic content. Colouring defines coprolites sharing highly similar pollen assemblages. Open circles represent presence at trace amounts (<2.5%). Black circles represent samples where there was insufficient sample to analyse organic content.

