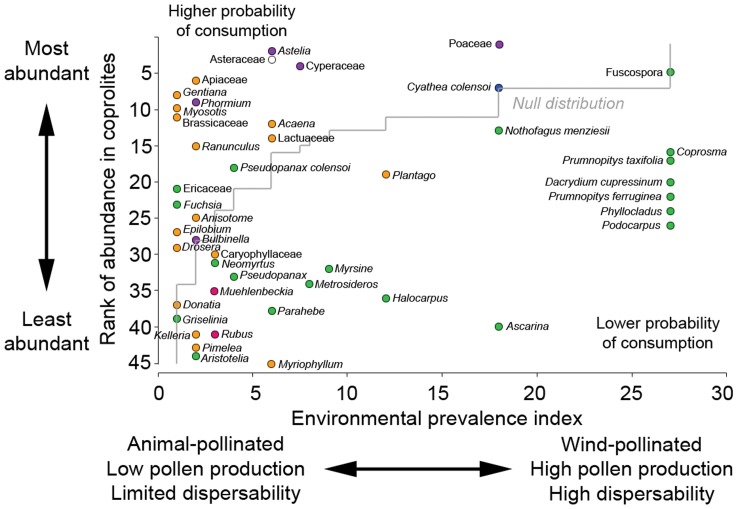
Figure 3. Ranked abundance of pollen/spore types in upland moa coprolites from Euphrates Cave vs. environmental prevalence index.
Ranked abundances are based on the summed percentages of each pollen taxon from all 35 coprolites (1 = most abundant pollen/spore type, 45 = least abundant pollen/spore type). Ground ferns, Lycopodium spp., and Anthoceros are not included as data used to calculate environmental prevalence index values were not provided for these taxa by [49]. The null (cumulative frequency) distribution line represents the hypothetical distribution of the pollen taxa if their abundance in the coprolites was directly related to their environmental prevalence. Pollen taxa plotting above this line are overrepresented in coprolites relative to their environmental prevalence, suggesting they may have been directly eaten. Pollen taxa plotting below this line are underrepresented in the coprolites, suggesting they may have been eaten more rarely, or incidentally ingested. Circle colours reflect plant types: green, trees and shrubs; orange, dicot herbs; pink, lianes; purple, monocot herbs; blue, ferns; white, undeterminable.

