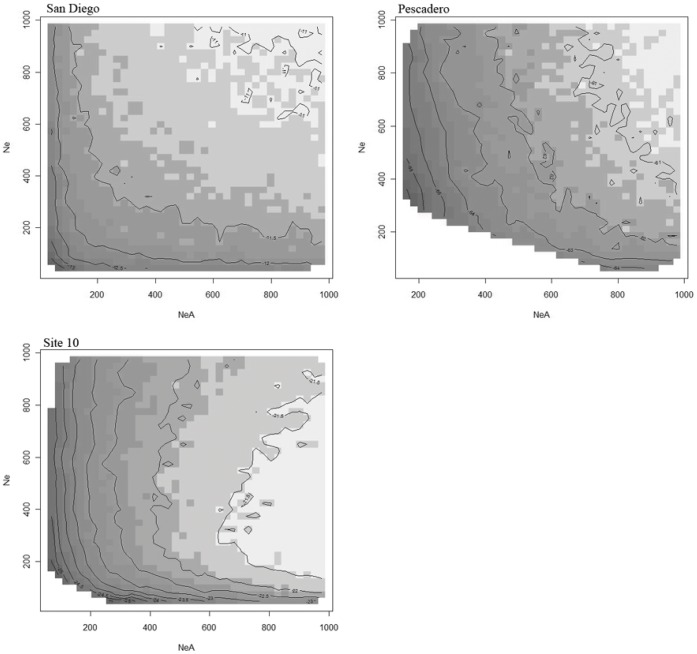
Figure 2. Log-likelihood surface plot of ancestral population size (N e A) versus contemporary population size (N e).
Estimates are based upon temporal changes in allozyme allele frequencies at Pgi in San Diego, Pescadero, and Site 10. The highest log-likelihood values are indicated by the white shaded contours.

