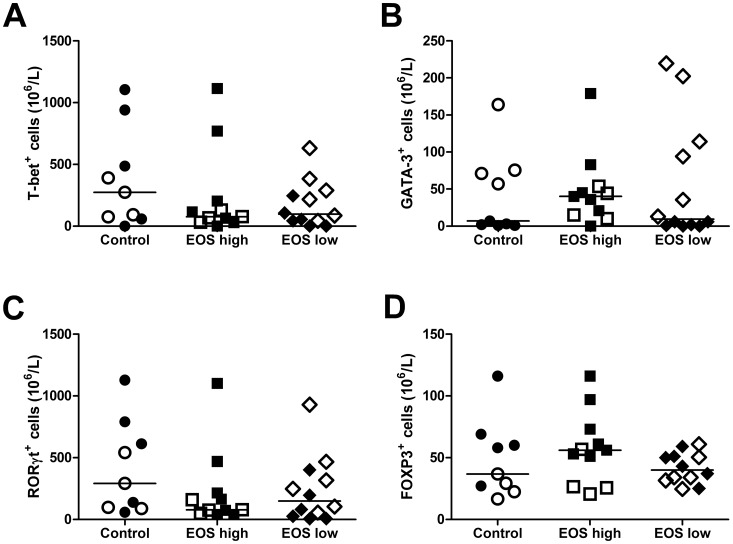
Figure 1. Transcription factors expressed by T cell subtypes.
Numbers of Th subtypes expressing the transcription factors T-bet (Th1; A), GATA-3 (Th2; B) RORγt (Th17; C) and FOXP3 (Treg; D) in the control (healthy non-asthmatics, n = 9), EOS high (asthmatics with elevated blood eosinophils, n = 11), and EOS low (asthmatics with low blood eosinophils, n = 12) groups. The horizontal line represents the median of the group. Filled symbols represent samples obtained in the winter time, while open symbols represent samples obtained during spring time.

