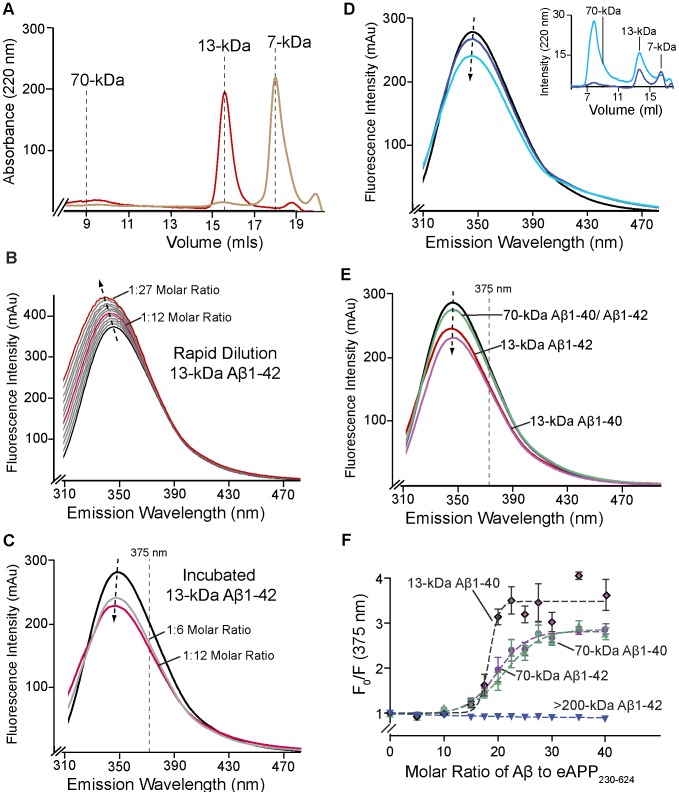
Figure 3. Aβ-binding to eAPP230–624 can be measured using intrinsic fluorescence.
A) Size-exclusion chromatography analysis of Aβ oligomer preparations using a Superdex 75 column and PBS as the running buffer. As an example, 13-kDa Aβ1-42 (red) and 7-kDa Aβ1-40 (gold) are shown. B) Emission spectra of the titration of 0.64 µM eAPP230–624 with 13-kDa Aβ1-42 from 0–13 µM (1∶0–1∶27 molar ratio) using rapid dilution and the Shimadzu RF-530PC. The aliquots were 100 µl each diluted into a starting volume of 3 mls. The black line indicates the starting concentration and the red line indicates the final concentration. The pink line indicates a molar ratio of 1∶12 protein to Aβ oligomers. The arrow indicates the direction of shift of the fluorescence peak. C) Emission spectra of the 0.5 µM eAPP230–624 incubated with a 1∶6 (grey) and 1∶12 (red) molar ratio of 13-kDa Aβ1-42 oligomers. The emission spectrum of eAPP230–624 alone is shown in black. D) Emission spectra of 0.5 µM eAPP230–624 with Aβ species greater than 200-kDa before sonication (dark blue) and after sonication (light blue). The inset compares the chromatogram of 0.1 µg Aβ species before (dark blue) and after sonication (light blue) using a calibrated Superdex 75 column with PBS as the running buffer. Before sonication, the Aβ oligomers do not enter the column. E) Emission spectra of the 0.5 µM eAPP230–624 incubated with a 1∶6 molar ratio of 13-kDa Aβ1-40 (lavender), 13-kDa Aβ1-42 (red), 70-kDa Aβ1-40 (green) and 70-kDa Aβ1-42 (purple). The spectra of the 70-kDa Aβ1-40 and Aβ1-42 are nearly completely superimposed, so that only the 70-kDa Aβ1-40 is visible F) Changes in the intrinsic fluorescence of eAPP230–624 resulting from incubation of with the same Aβ oligomers from D and E:13-kDa Aβ1-40 (black with lavender center), 70-kDa Aβ1-40 (green), 70-kDa Aβ1-42 (purple), >200-kDa Aβ1-42. The dominant sizes of the Aβ oligomers were determined by size-exclusion chromatography. None of the oligomers were purified, so the size represents only the major species in the mixture. The excitation wavelength was 295 nm for all spectra and the data were measured using the Spectramax XPS.

