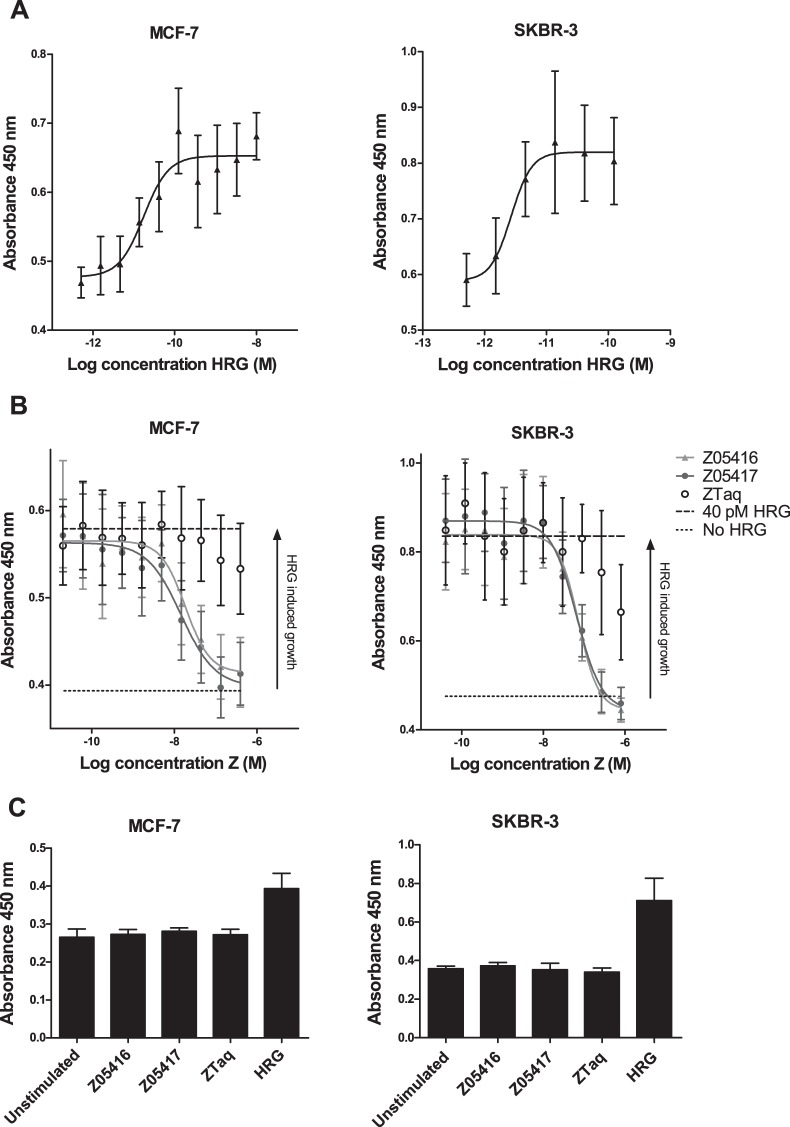
Figure 6. Analysis of cellular growth inhibitory effects of the HER3-specific Affibody molecules.
Mean absorbance values at 450 nm ± SD, which is proportional to the number of living cells, is given on the y-axis. A. Proliferation of MCF-7 and SKBR-3 cells grown in a dilution series of HRG. B. Proliferation of MCF-7 and SKBR-3 cells grown in 40 pM HRG and a dilution series of Affibody molecules Z05416, Z05417 or ZTaq. C. Proliferation of cells grown in medium containing 40 nM Affibody molecules, 0.04 nM HRG. Results are compared to unstimulated cells (no Affibody molecules or HRG added).

