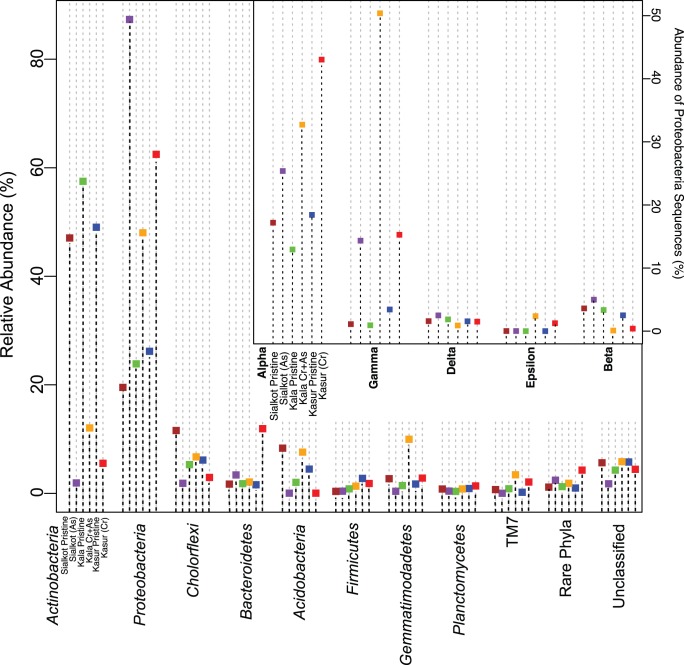
Figure 2. Phylogenetic distribution of the dominant phyla identified by pyrosequencing.
The dominant phyla identified in pyrosequencing libraries are ordered by relative dominance in the pyrosequencing libraries. Each sampling site is represented by color and order is consistent for all phyla. Distribution of proteobacterial classes is described in the inset panel. Abundance was based on the total number of proteobacterial sequences recovered at each site. Little variation between sub-samples for each site was observed thus error bars were left out of figure for clarity.

