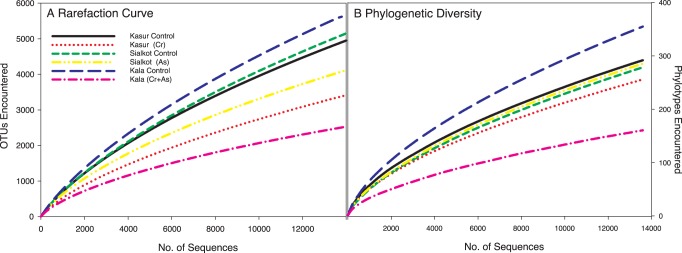
Figure 3. Alpha-diversity analysis using rarefaction (A) and phylogenetic diversity (B) of contaminated and control soils.
Each soil is represented by color and pattern. Rarefaction analysis focuses on discovery of novel species level (97%) Operational Taxonomic Units (OTUs) while phylogenetic diversity focuses on the discovery of novel phylogenetic branches.

