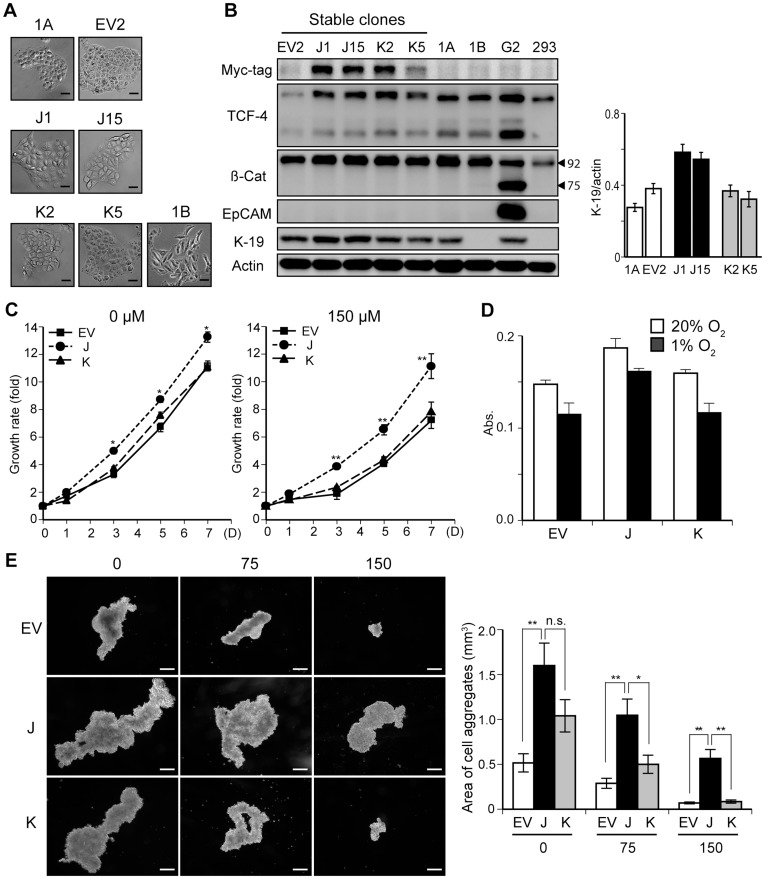
Figure 3. TCF-4J-overexpressing cells proliferate under hypoxic conditions.
(A) Phase-contrast microscopy of parental HAK-1A (1A) and 1A-derived stable clones, including the empty vector-transfected clone (EV2), the TCF-4J-transfected clones (J1 and J15), and the TCF-4K-transfected clones (K2 and K5). The morphologic appearance of the highly malignant HAK-1B (1B) cell line, a clonally dedifferentiated cell type from 1A, is also presented for comparison. Bar = 50 µm. (B) Immunoblot analysis of stable cell clones. Positive signals for Myc-tag are shown in J1, J15, K2, and K5. HepG2 cells (G2) known to express both full-length (92 kDa) and truncated β-catenin (75 kDa), exhibited a lower band for β-catenin (β-Cat) HepG2 was also used as a positive control for EpCAM and K-19 expression. HEK293 was used as a negative control for K-19. (C) Cell growth rates of stable clones under the hypoxic conditions generated by CoCl2 (150 µM) for 7 days. Growth rate is represented as the fold-increase compared to day 0. (D) Cell growth of stable clones in normoxia (20% O2) or hypoxic conditions (1% O2) Cells were exposed to either 20% or 1% oxygen for 5 days. Note that reduction of cell growth in hypoxic contidions was less in J cells (13%) compared to EV (22%) and K (27%) cells. (E) Anchorage-independent growth assay (sphere assay). Phase-contrast microscopic views of representative cell aggregates are displayed at 0, 75, and 150 µM of CoCl2. Bar = 300 µm. Note the striking difference in colony growth rate and appearance at 150 µM of CoCl2. *p<0.05; **p<0.01.

