
Figure 7. Longitudinal spectral domain optical coherence tomography (SD-OCT) scans.
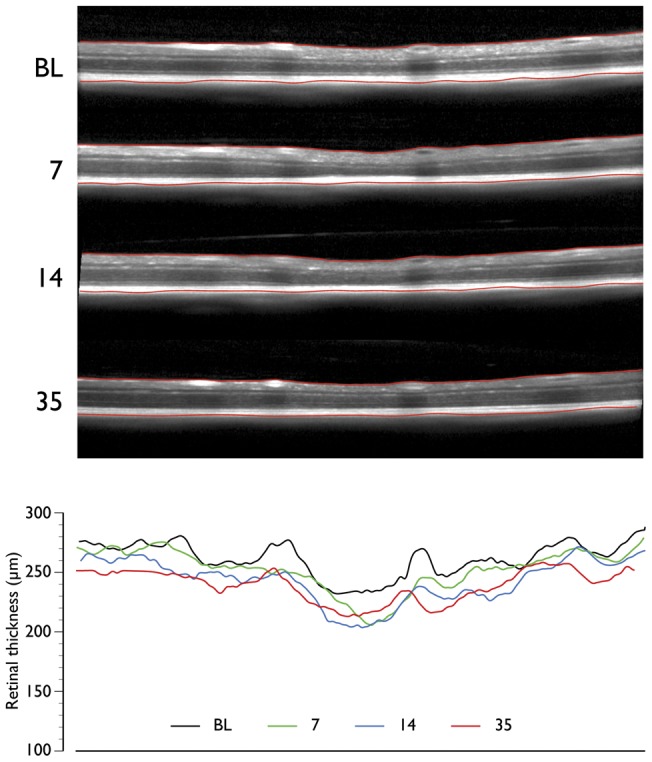
SD-OCT B-scans at the same line in a raster scan at baseline (BL) and 7, 14 and 35 days after optic nerve head transection (top panel). The segmentation of the retina is also shown (red lines demarcating the inner limiting membrane and retinal pigment epithelium). Retinal thickness values at corresponding time points at corresponding locations (bottom panel).