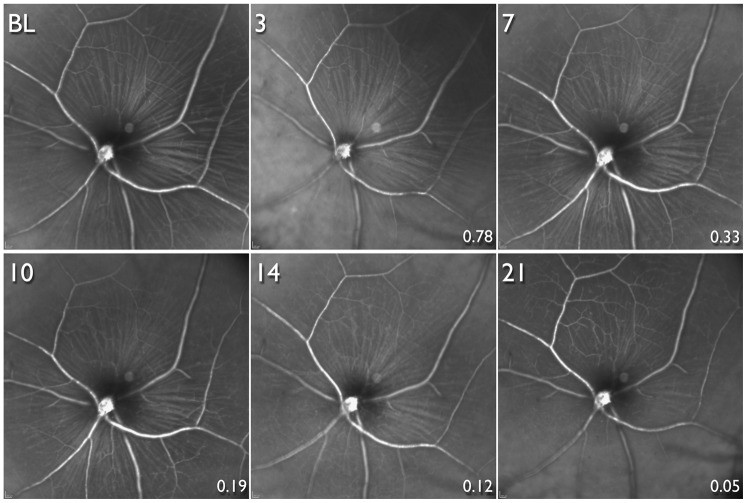
Figure 8. Longitudinal infrared scanning laser ophthalmoscopy images.
Images are from the same animal, and at the same time-points and location (but focused on the retinal nerve fibre layer, RNFL) as the animal shown in Fig. 4. Optic nerve head transection was performed after obtaining the baseline (BL) image. Longitudinal images obtained 3, 7, 10 14 and 21 days after optic nerve transection. The RNFL appears unaltered until there was substantial loss of cyan fluorescent protein positive (CFP+) cells. The numbers at the bottom right of each image after BL show the proportion of CFP+ cells surviving compared to BL in this animal.

