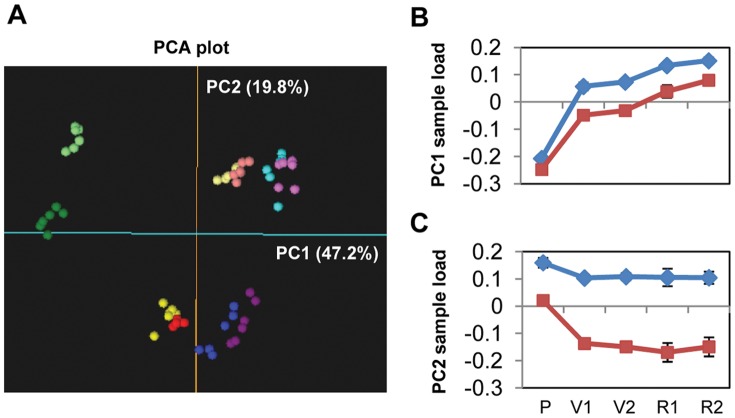
Figure 1. PCA plot of ‘Muscat Hamburg’ pericarp samples according to their expression data.
A, PCA plot of flesh and skin ripening samples according to their RMA normalized expression data. The first (PC1) and the second (PC2) principal components are represented. Expression data of probe sets matching the same unique transcript were averaged before the PCA. Six samples corresponding to three biological replicas collected in two different years were analyzed per developmental stage. Green, pre-veraison (15 mm); yellow, 50% veraison; red, 100% veraison; blue, ripe 1; purple, ripe 2. Flesh: light colors; Skin: dark colors. B, Stage averaged PC1 loading scores for flesh and skin apart. C, Stage averaged PC2 loading scores for flesh and skin apart. At B and C, blue, flesh; dark red, skin. P, pre-veraison (>15 mm); V1, 50% veraison; V2, 100% veraison; R1, ripe 1; R2, ripe 2. Error lines indicate stage replicates standard deviation.

