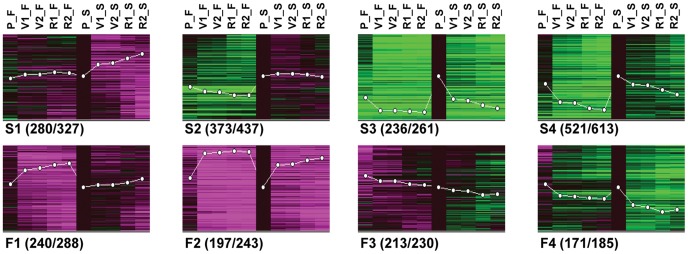
Figure 2. Expression patterns of transcripts differentially accumulated between flesh and skin throughout ‘Muscat Hamburg’ grape ripening.
The 2584 significant probe sets (2232 unique transcripts) were allocated into 8 clusters. S. Profiles of transcripts with higher accumulation in the skin than in the flesh: S1, transcripts specifically or more highly up-regulated in the skin; S2, transcripts with constant expression in the skin and repressed in the flesh; S3, genes down-regulated in both skin and flesh; S4, transcripts either specifically, or more highly, or earlier down-regulated in the flesh. F. Profiles of transcripts with higher accumulation in the flesh than in the skin: F1, transcripts specifically or more highly up-regulated in the flesh; F2, transcripts up-regulated in both flesh and skin; F3, transcripts with a constant accumulation or slightly down-regulated in both tissues; F4, transcripts down-regulated in both flesh and skin. Expression data were normalized to pre-veraison skin: black, same expression; green, lower expression; magenta color, higher expression than in pre-veraison. White lines indicate the mean expression pattern of the clusters. Numbers in brackets correspond to non-redundant transcripts represented in the cluster/cluster included probe sets. P, pre-veraison (>15 mm); V1, 50% veraison; V2, 100% veraison; R1, ripe 1; R2, ripe 2.

