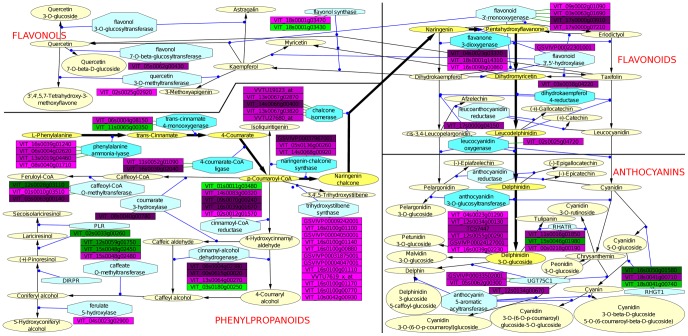
Figure 3. Phenylpropanoids-related transcripts showing significant differences between flesh and skin throughout ripening represented in VitisNet networks.
Rectangles represent non-redundant transcripts differentially expressed; colors are defined according to the clusters represented in Figure 2: shades of green represent mRNAs with higher expression in flesh; shades of purple represent mRNAs with higher expression in skin. Lighter to darker colors represent cluster 1 to cluster 4.Yellow ovals: metabolites; blue hexagons: enzymes; black arrows: metabolic reactions; blue arrows: catalytic reactions; green arrows: translation reactions. Darker yellow and blue color shades and bold arrows highlight the reactions starting from phenylalanine leading to anthocyanidin biosynthesis.

