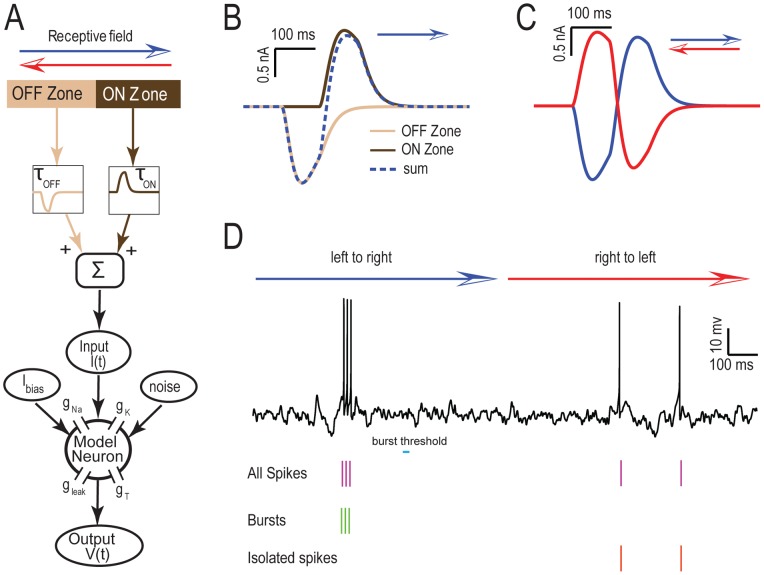
Figure 1. Modeling directional selectivity in TS neurons.
A) Schematic of our model. The receptive field is composed of two zones: the OFF zone which represents the output of I-type ELL pyramidal cells with synaptic depression time constant τOFF while the ON zone represents the output of E-type ELL pyramidal cells with synaptic depression time constant τON. The responses from each zone are then fed into a Hodgkin-Huxley model with spiking sodium (gNa), delayed rectifier potassium (gK), leak (gleak), and T-type calcium (gT) conductances. Noise is also added to this model in order to mimic synaptic input from other neurons. B) Inputs from OFF zone (beige), ON zone (brown), and the sum of the two (dashed blue) for τ1 = τ2 = 500 msec when the object moves from left to right (i.e. from the OFF zone to the ON zone). C) Summed input from both zones when the object moves from left to right (blue) and from right to left (red). D) Segregating the spike train to bursts and isolated spikes. The top trace is an example membrane potential trace for one trial (object moves from left to right and then from right to left) from our model in response to the inputs shown in C. Spikes (purple lines) belonging to interspike intervals that were less than the burst threshold (cyan) were identified as belonging to bursts (green lines) while those that do not were identified as isolated spikes (red lines).

