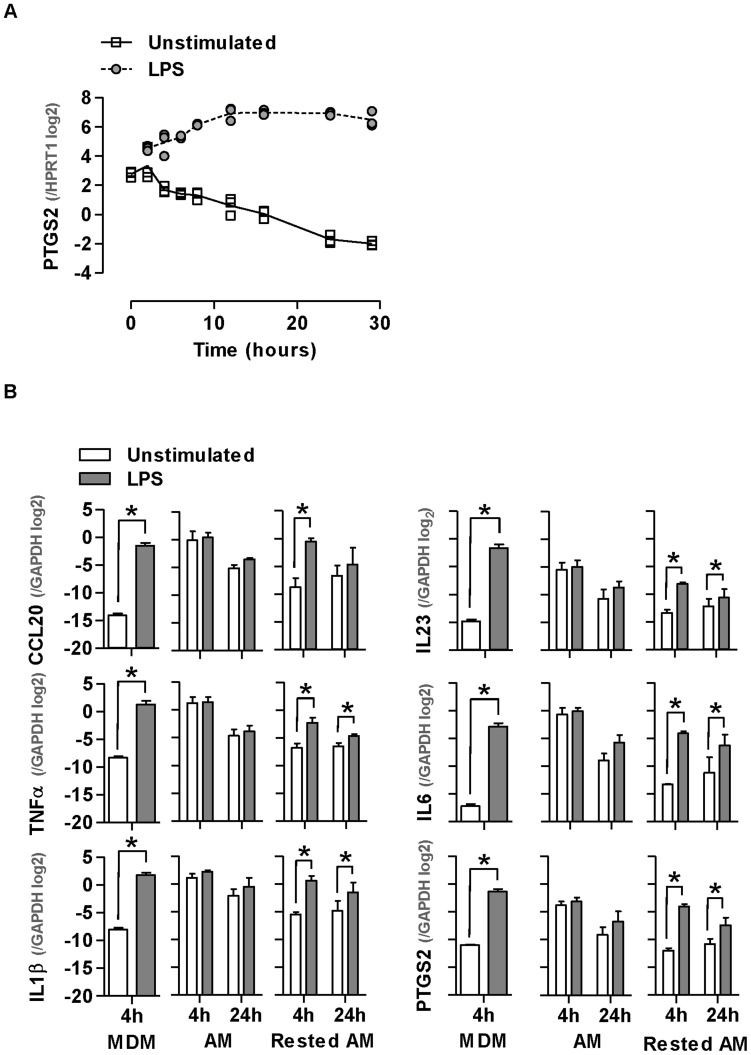
Figure 4. Reduction of AM inflammatory gene expression with time in culture.
(A) AM show a significant reduction in PTGS2 expression over time (p<0.0001, ANOVA). Data points represent technical replicates of measurements from one patient with DIP. (B) Selected gene expression changes identified by microarrays are validated by qPCR. Basal pro-inflammatory gene expression is reduced in AM which have been rested for 48 hours and upregulated following LPS stimulation. Bars represent mean ±SEM for at least 4 separate experiments (*denotes p<0.05, t-test).

