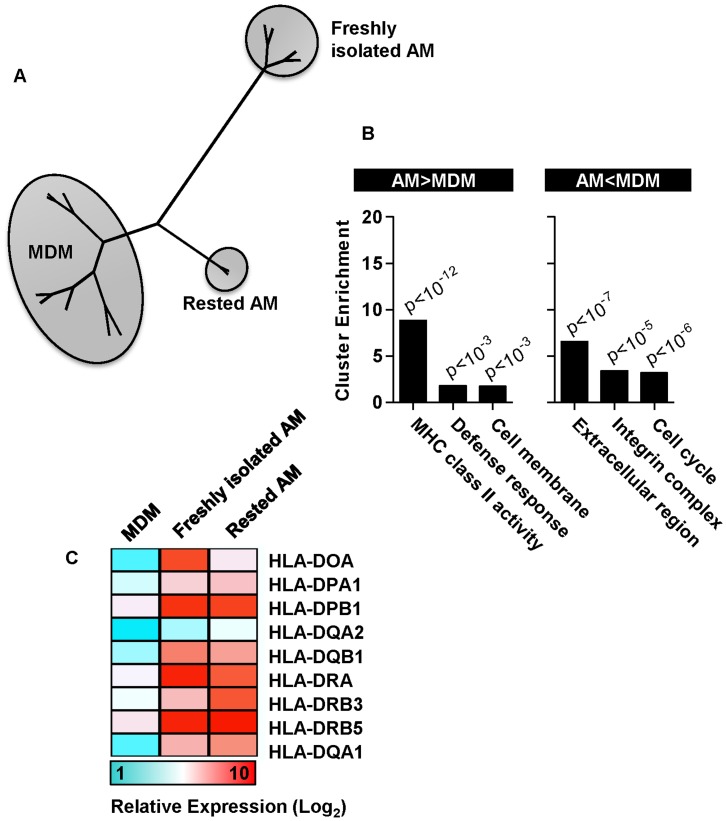
Figure 5. Genome-wide comparison of MDM with freshly isolated and rested AM.
(A) Hierarchical clustering of whole genome expression profiles showed greatest difference between MDM and freshly isolated AM, and closer clustering of rested AM to MDM. (B) Significant gene expression differences between rested AM and MDM assessed by gene ontology functional cluster analysis, showed greatest enrichment for upregulated expression in AM of genes associated with MHC class II antigen presentation pathways. (C) Mean relative gene expression levels are presented in MDM and AM for genes included in this cluster.

