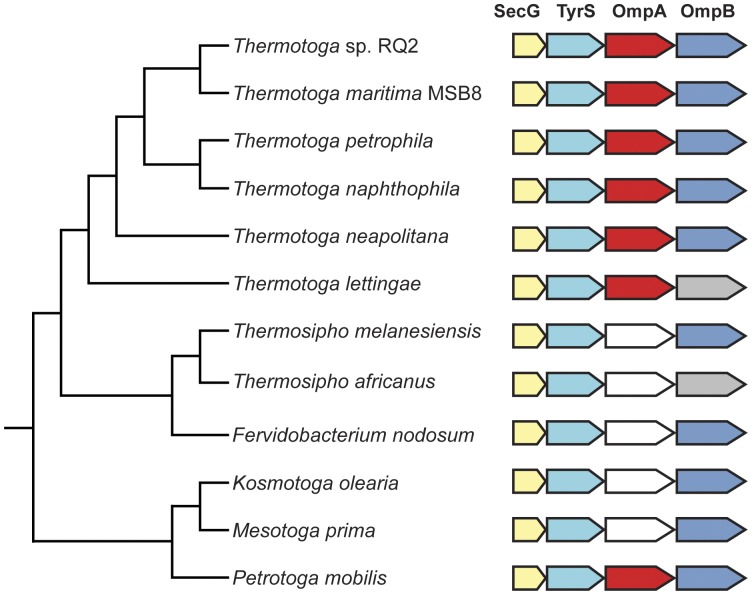
Figure 1. Syntenic regions containing T. maritima OmpA1 and OmpB homologs and putative analogs mapped onto an rRNA gene reference tree.
The coloring of the individual genes indicates whether the gene is a homolog, paralog, or putative analog. segG homologs are yellow, tyrS homologs are light blue, ompA1 homologues are red, and ompB homologues are dark blue. ompA paralogs are white (see Fig. 2). ompB putative analogs are grey. The tree is a concatenated 23S-16S rRNA gene cladogram. Branch lengths do not reflect the extent of divergence.

