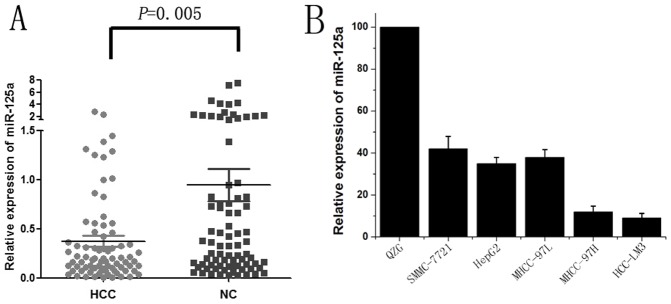
Figure 1. Down-regulation of miR-125a in HCC tissues and cell lines.
The expression of miR-125a in tissues and cell lines was detected by qRT-PCR analysis, and the results shown are the mean value of three repetitions calculated by 2−△△Ct with U6 snRNA as the internal control. (A) MiR-125a expression in 80 HCC and paired adjacent non-tumor liver tissues. A significantly lower expression level of miR-125a was observed in HCCs compared with that in adjacent liver tissues (P = 0.005). (B) Relative fold changes of miR-125a in HCC cell lines compared to the normal Liver cell line QZG.

