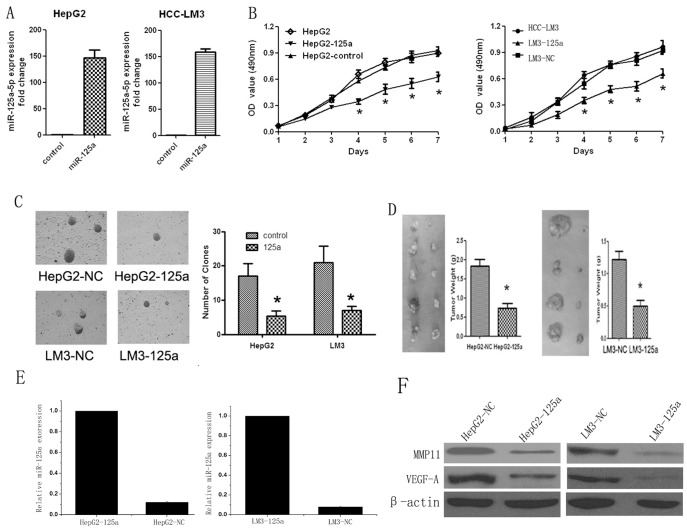
Figure 2. Inhibition of cell proliferation by ectopic expression of miR-125a in vitro and in vivo.
(A) qRT-PCR analysis confirmed that miR-125a expression was significantly up-regulated in HepG2-125a and LM3-125a cells compared with matched controls. U6 snRNA was used as the internal control. (B) The growth curves are plotted based on the MTT assay results. The data presented are the mean value of three repetitive determinations. (C) The colony numbers shown are the mean of three repetitions, and are expressed as the mean ± SD. (D) In vivo tumorigenicity in nude mice. HepG2-125a or LM3-125a cells were injected into the right flanks and their matched controls were injected into the left flanks of mice. Four weeks later, the tumors were resected from the mice, and calculated using the formula: L×S2 /2. (E and F) qRT-PCR and western blot showed that the expression of miR-125a in the tumor from right flank were significantly lower that the left flank. Inversely, both the expression of MMP11 and VEGF-A were significantly higher in the right flank were significantly lower that the left flank (Fig. 2 E and F). *P<0.05 VS matched controls.

