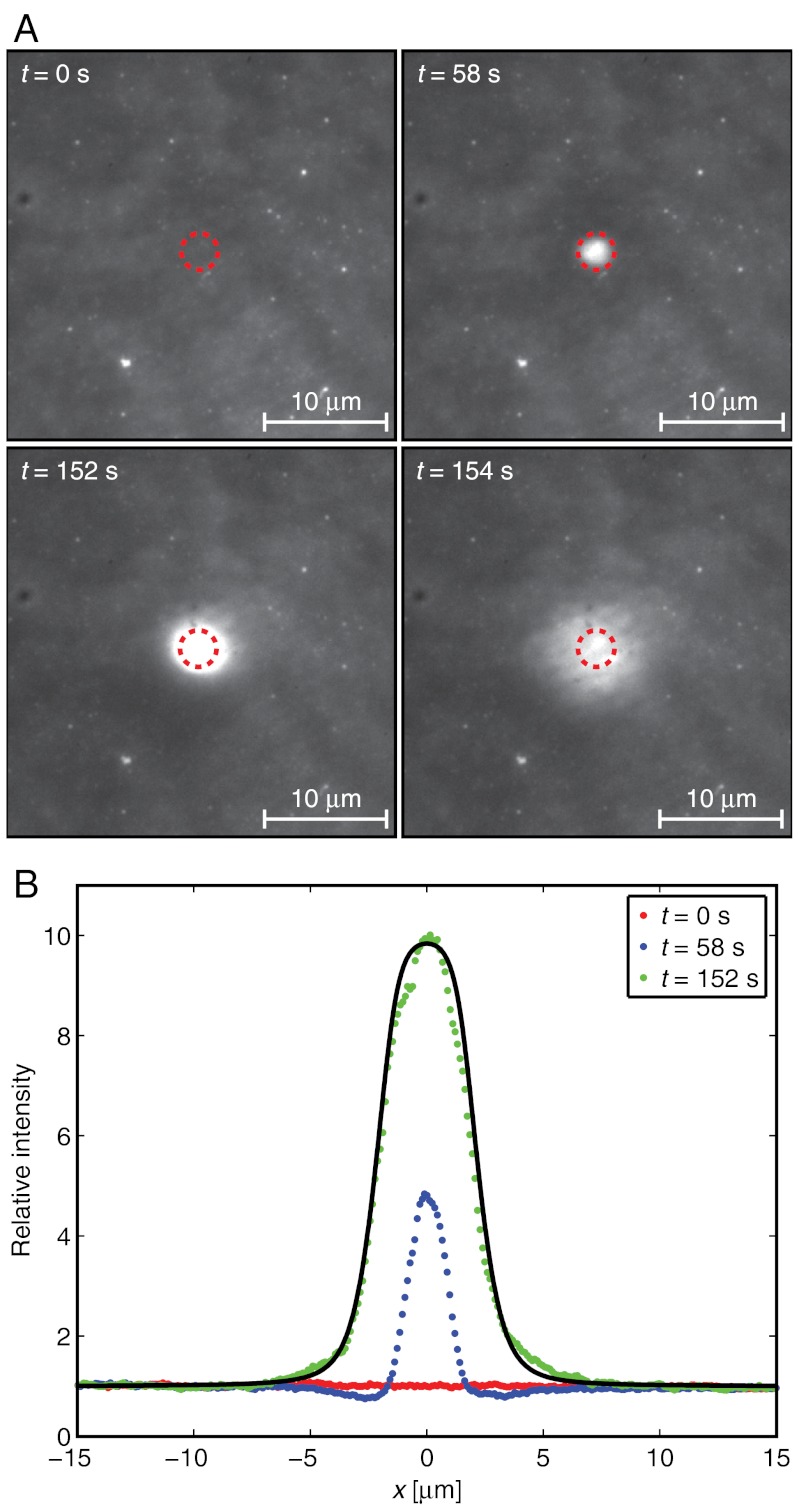
Fig. 3.
Trapping of fluorescently labeled SA. (A) Images showing the fluorescence intensity from SA bound to an SLB at different times. The hydrodynamic trap was turned on at t = 56 s and off at t = 153 s. Dashed circles correspond to the size of the tip aperture of the pipette. (B) Line profiles of the relative intensity through the center of the trap. The solid line is a fit to Eq. 8 of the data at t = 152 s.

