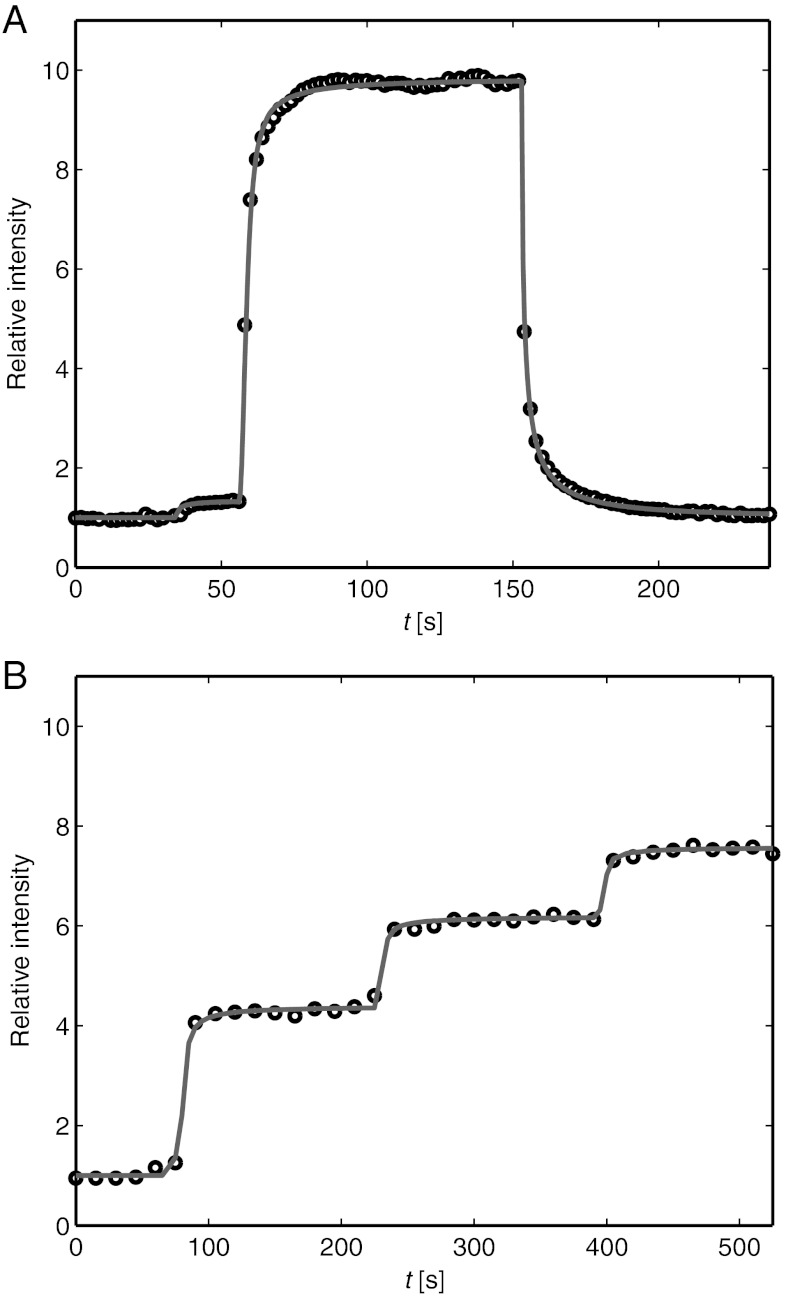
Fig. 5.
Kinetics of the hydrodynamic trap. (A) The relative intensity from SA at r = 0 vs time when a pressure of -6 kPa was applied at t = 56 s. At t = 153 s the pipette is moved away from the surface and the pressure is turned off. (B) The relative intensity at different applied pressures (from left to right): 0 kPa, -0.6 kPa, -1.1 kPa and -2.0 kPa, respectively. The solid lines correspond to values from finite element simulations.

